Week 6 : Alert Management Control Plane
What We Are Building
InfraWatch Alerts — a production alert management console modeled after PagerDuty and Datadog:
Rule engine — Threshold, anomaly, and expression-based rules with templates
Evaluation pipeline — Sustained breach detection, deduplication, suppression windows
Lifecycle processing — Severity scoring, escalation policies, auto-resolution
Query plane — Search, statistics, bulk operations, CSV/JSON export
Operator console — Dark-theme dashboard with live WebSocket updates
Notification routing — Channel delivery with circuit-breaker protection
Core Concept: Signal vs Noise
Every monitoring platform ingests thousands of metric points per minute. The hard problem is not detection — it is deciding which signals deserve human attention. Datadog and PagerDuty solve this with pending timers (avoid flapping), fingerprint deduplication (one alert per root cause), and suppression windows (maintenance silence).
The non-obvious insight: alert state is a first-class entity, not a side effect of rule evaluation. A rule fires; an alert instance is born with its own lifecycle. Operators acknowledge, escalate, and resolve alerts — not rules.
Where This Fits
Metrics Collection          raw telemetry
        │
Background Processing       scheduled evaluation jobs
        │
Alert Management            ◀ this lesson
        │
Notifications               delivers outcomes to humans
Alerts sit between completed metric pipelines and human response. They assume metrics arrive reliably and workers can evaluate rules on schedule.
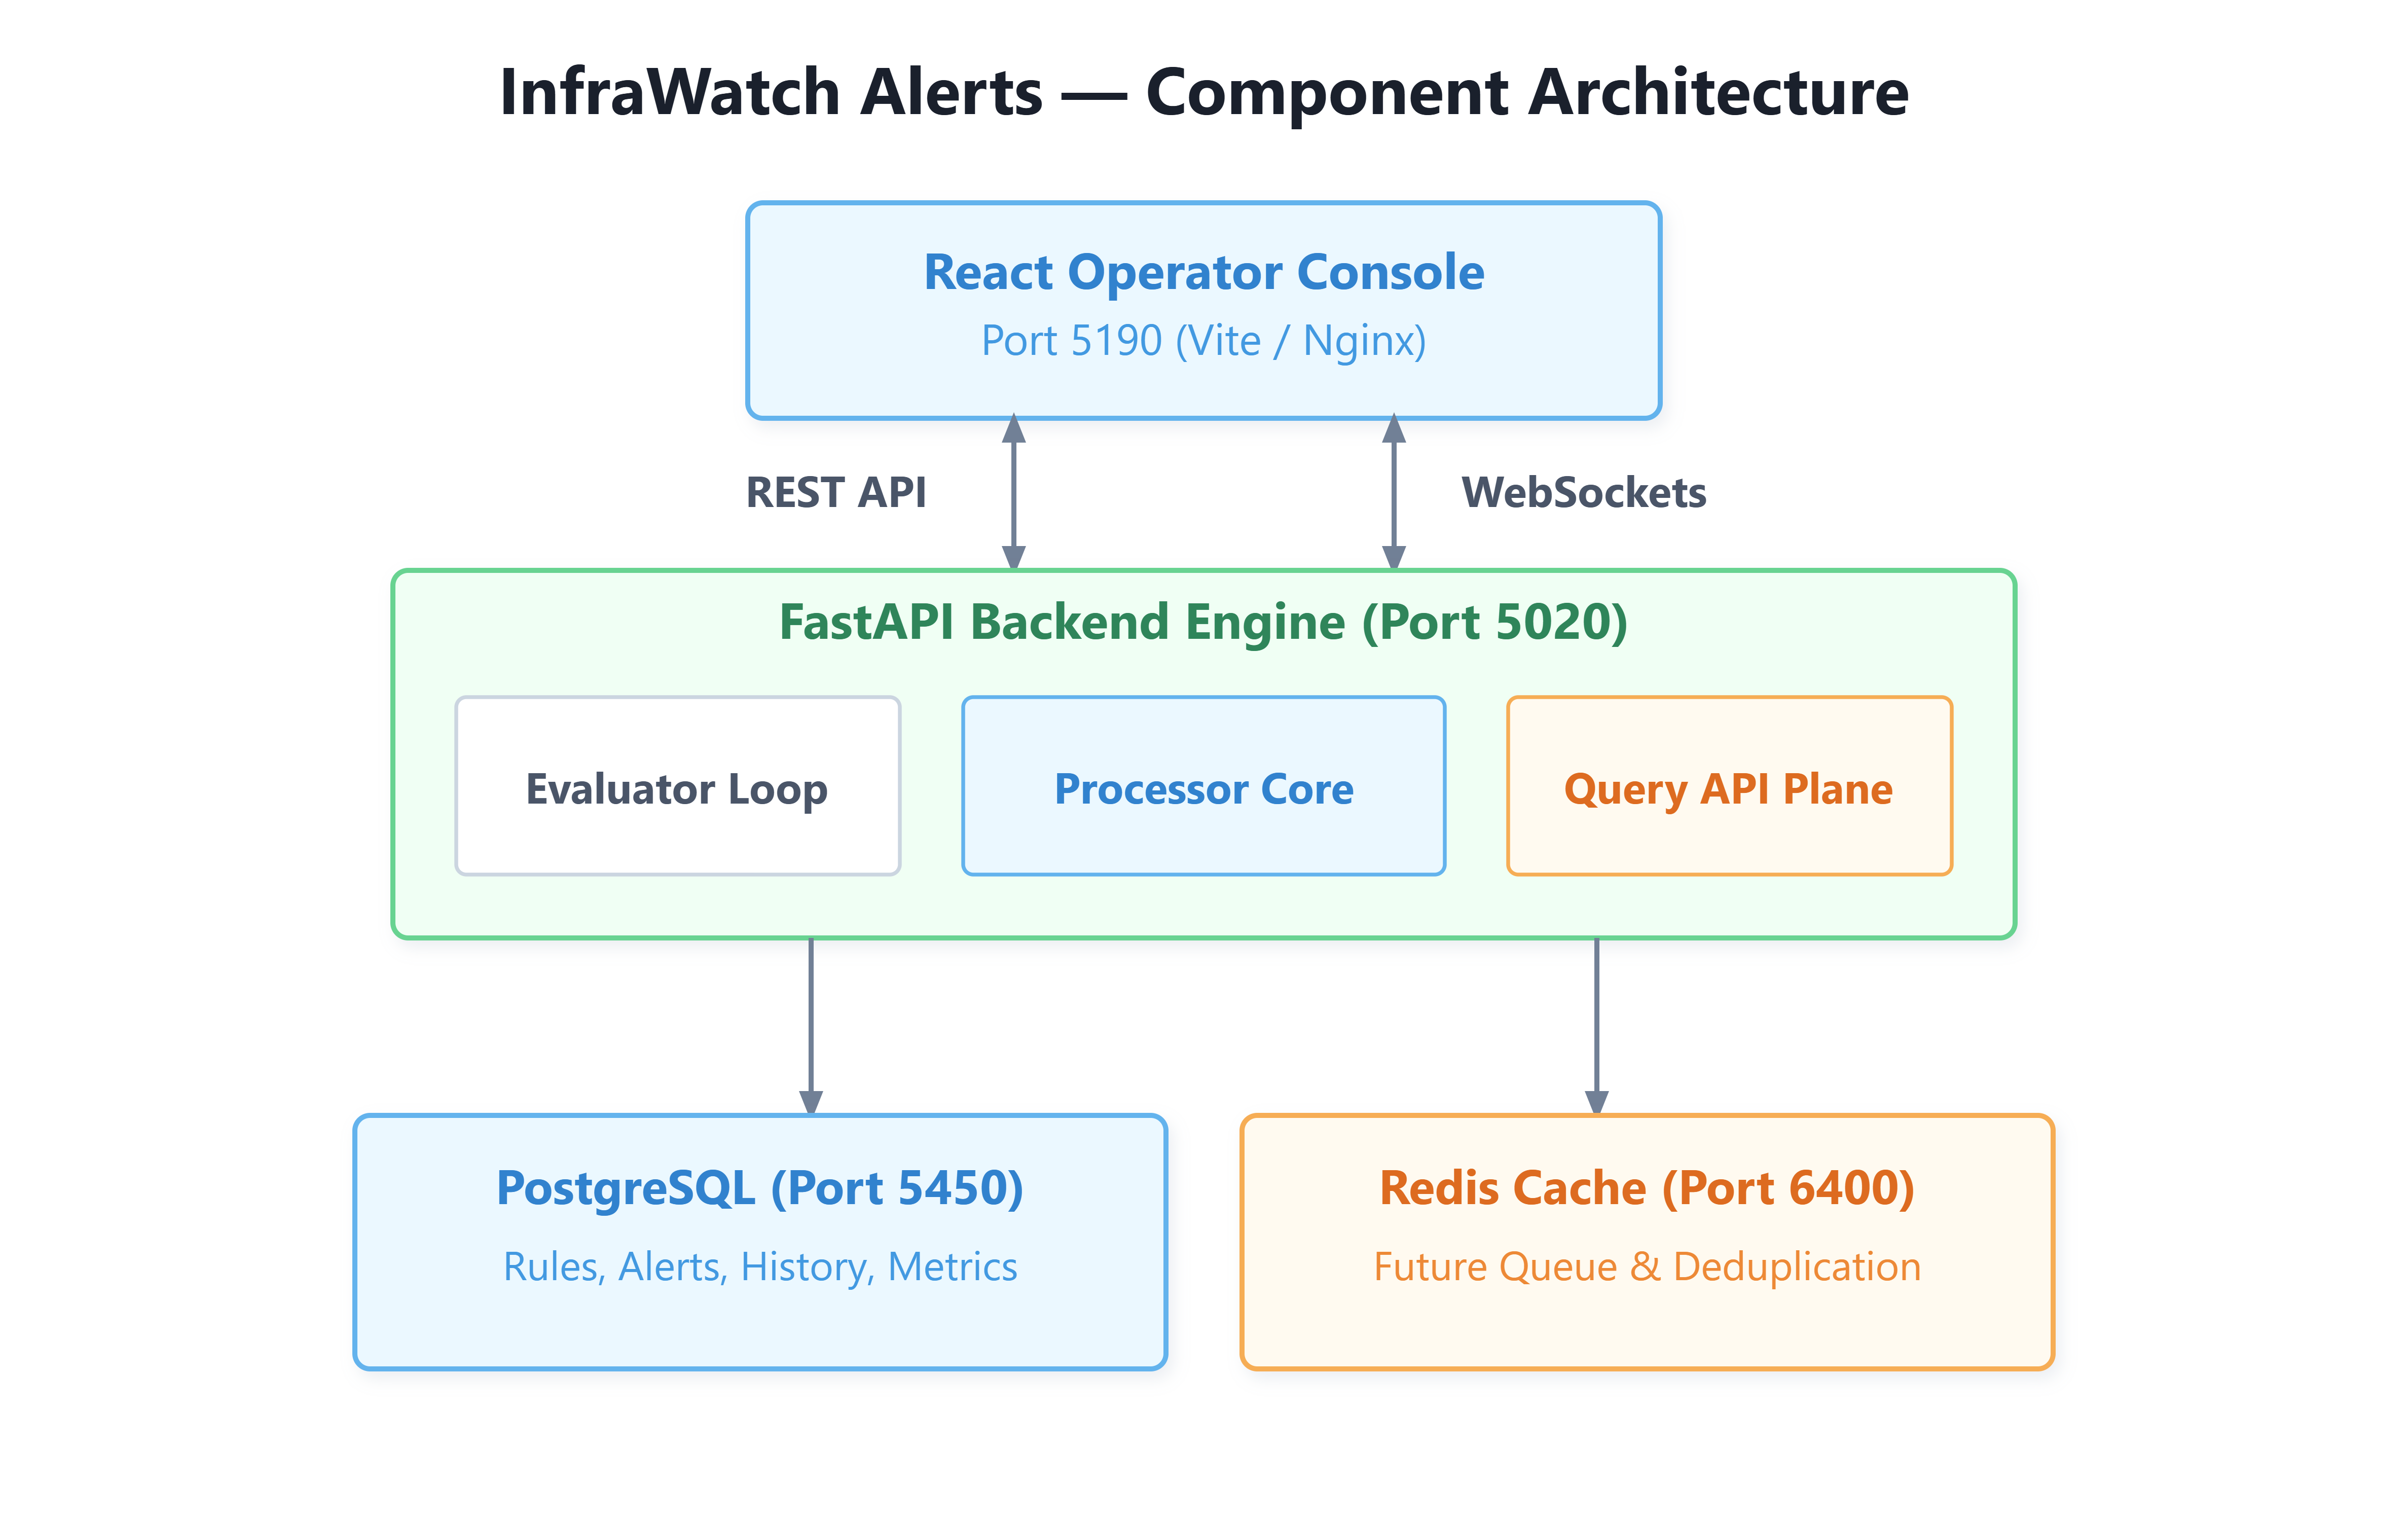
Component Architecture
Ingest — Agents POST metric samples; each sample triggers rule evaluation.
Evaluator — Compares values against thresholds or Z-score anomaly models.
Processor — Manages pending→firing transitions, severity scoring, history audit.
Query API — Powers search, statistics, and export for the operator console.
WebSocket — Pushes state changes to the dashboard without polling.