Week 4: Metrics Collection Platform
🗄️ 52 FAANG Interview Question Vault — $299 one-time
All 52 walkthroughs + 52 drill cards + 6 framework cheatsheets + the Senior+ System Design Playbook. Everything, immediately. Lifetime access with all future updates included.
What We Are Building
This lesson delivers a production-grade metrics collection and observability console for InfraWatch:
Time-series schema — Raw points, retention policies, metric catalog, and pre-aggregated rollups
Collection pipeline — Agent protocol, validation, batch ingestion, and scheduled collection
Storage layer — PostgreSQL persistence with Redis hot-path cache and pub/sub streaming
Aggregation engine — Sliding-window statistics, historical rollups, and trend detection
Query API — Time-range queries with caching, CSV/JSON export, and summary endpoints
Observability console — Datadog-style dashboard with live charts and agent status
Core Concept: Write Path vs Read Path
Production metrics systems split into two lanes. The write path accepts high-volume, fire-and-forget data points from agents—validate, index, persist, and push to a hot cache in milliseconds. The read path serves dashboards and alerts—query pre-aggregated buckets first, fall back to raw data only when needed, and cache results by time range.
The insight most tutorials skip: retention is a write-time decision, not a cleanup cron job. When a point lands, the system already knows its tier (
realtime,recent,daily) and expiry date based on metric name patterns. Datadog and Grafana Cloud use this pattern—policy resolution at ingest keeps query performance predictable as volume grows.
Where This Fits in the Overall System
Server Fleet Management        inventory spine — agents attach here
        │
Metrics Collection             ◀ this lesson
        │
Alert Management               rules evaluate against stored series
        │
Notification System            delivers when thresholds breach
You are building the telemetry pipeline that turns raw host signals into queryable time-series. Every alert rule and capacity plan downstream assumes this layer exists and returns data within SLA.
Component Architecture
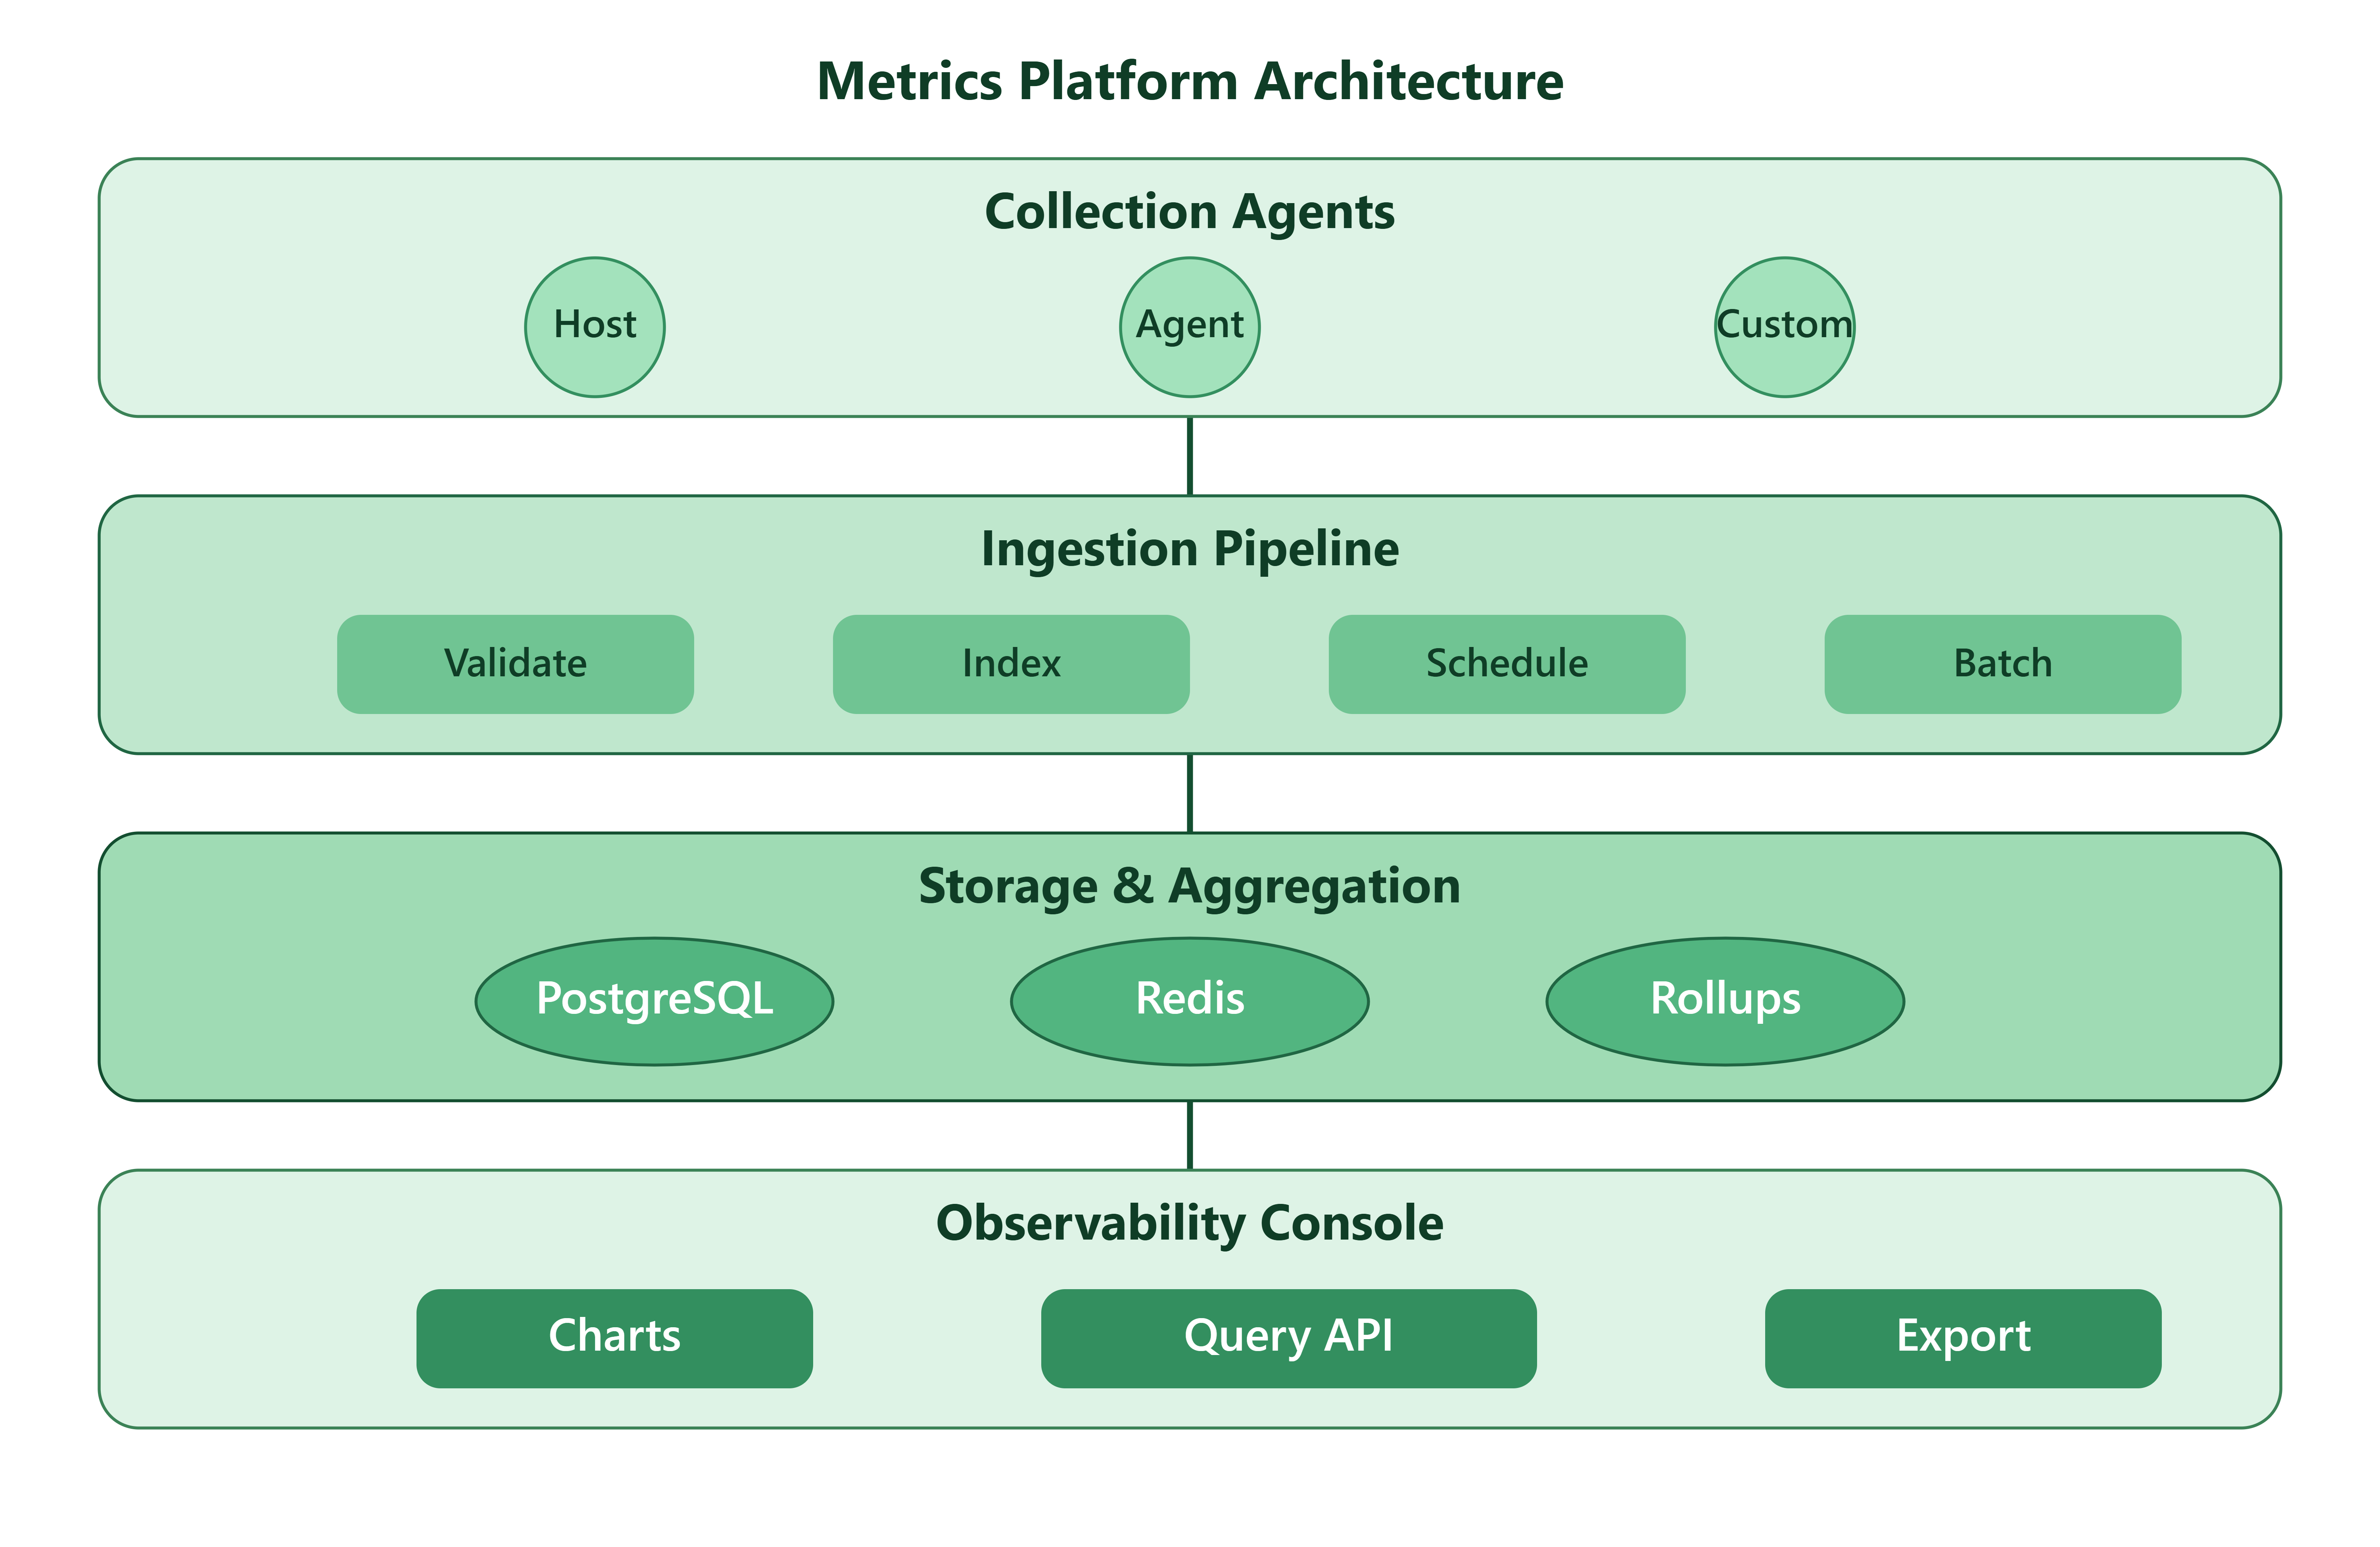
Agents — Lightweight collectors (psutil-based) push validated batches over WebSocket every five seconds.
Ingestion — Validator rejects out-of-range values; ingester dual-writes to PostgreSQL and Redis; catalog index updates on every point.
Aggregation — Background collector plus sliding-window engine compute avg/min/max/p95; rollups compress raw data into 1m/5m/1h buckets.
Query API — FastAPI serves cached queries, exports, summaries, and SSE streams for live dashboards.
Console — Dark-theme React UI polls REST every five seconds and receives WebSocket push on new points.