Week 3 : Server Fleet Management
🗄️ 52 FAANG Interview Question Vault — $299 one-time
All 52 walkthroughs + 52 drill cards + 6 framework cheatsheets + the Senior+ System Design Playbook. Everything, immediately. Lifetime access with all future updates included.
What We Are Building
This lesson delivers a production-grade server fleet control plane for InfraWatch:
Inventory domain — Rich server models with lifecycle state, health telemetry, tags, dependencies, and audit history
Operations API — CRUD with pagination, soft-delete, advanced search, bulk actions, groups, and templates
Validation layer — IP/hostname checks, TCP connectivity, HTTP health, SSL expiry, and network discovery
Credential plane — SSH key generation, encrypted storage, rotation, and connection testing
Live console — Datadog-style React dashboard with real-time WebSocket health updates
Core Concept: Inventory as the Source of Truth
Every metrics pipeline, alert rule, and automation workflow in a platform like Datadog or PagerDuty starts with one question: which servers exist right now, and are they reachable? Server inventory is not a spreadsheet—it is the authoritative graph that downstream systems query before they act.
The insight most tutorials skip: lifecycle state and health state are different axes. A server can be
activein provisioning terms butdegradedin health terms. Mixing them into onestatusfield breaks autoscaling logic (which cares about lifecycle) and paging logic (which cares about health). InfraWatch Fleet keeps both dimensions explicit.
Where This Fits in the Overall System
Authentication Foundation     identity gate for all API calls
        │
Server Fleet Management       ◀ this lesson
        │
Metrics Collection            time-series from known inventory
        │
Alerts & Notifications        rules evaluated per server identity
You are building the inventory spine that metrics agents attach to and alert engines evaluate against. Without it, alerts fire on hostnames nobody registered—or worse, on hosts that were decommissioned last week.
Component Architecture
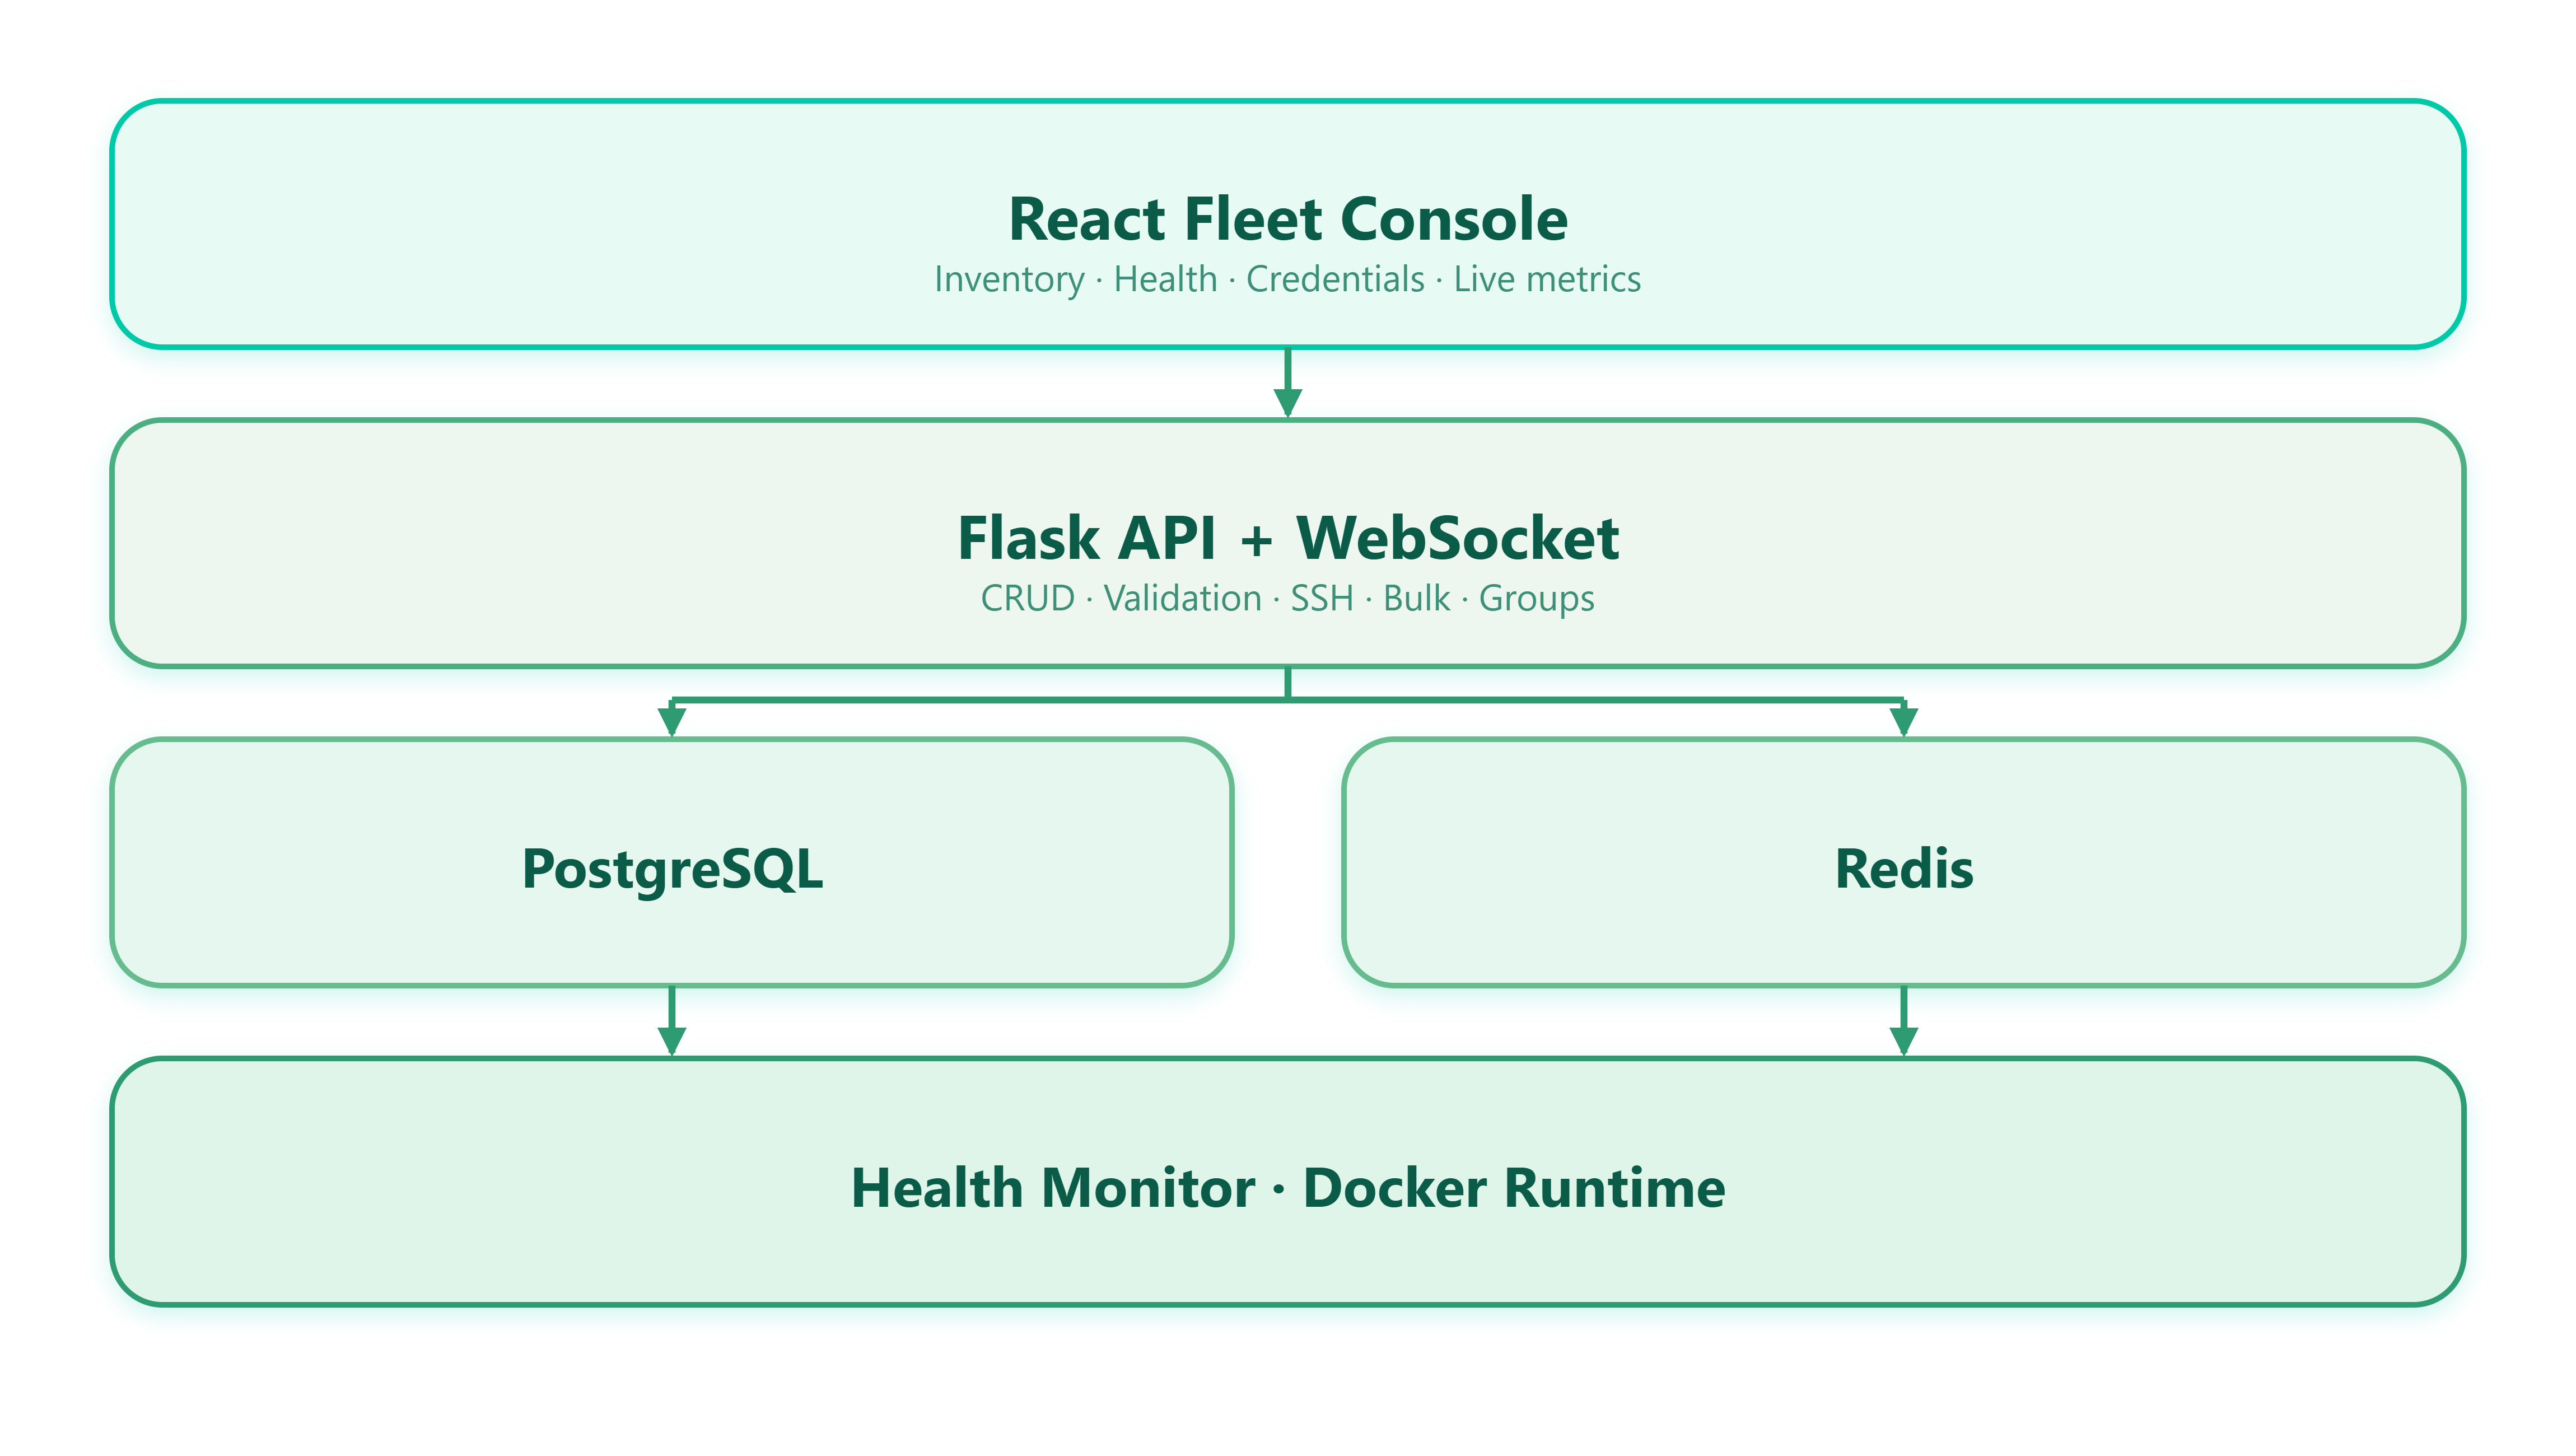
Presentation — Dark-theme React console: fleet overview metrics, searchable inventory grid, validation tools, credential manager. Polls REST every 15 seconds; WebSocket pushes health deltas instantly.
API — Flask blueprints under
/api/v1. Thin routes delegate to services:server_service,health_service,ssh_service,bulk_service.State — PostgreSQL stores servers, tags, groups, templates, audit logs, SSH keys. Redis caches health snapshots and increments check counters.
Runtime — Background health monitor runs every 30 seconds. Docker Compose orchestrates Postgres 16, Redis 7, API, and UI.