Day 86: Kubernetes Integration
Building Production-Grade Cluster Monitoring
What We’re Building Today
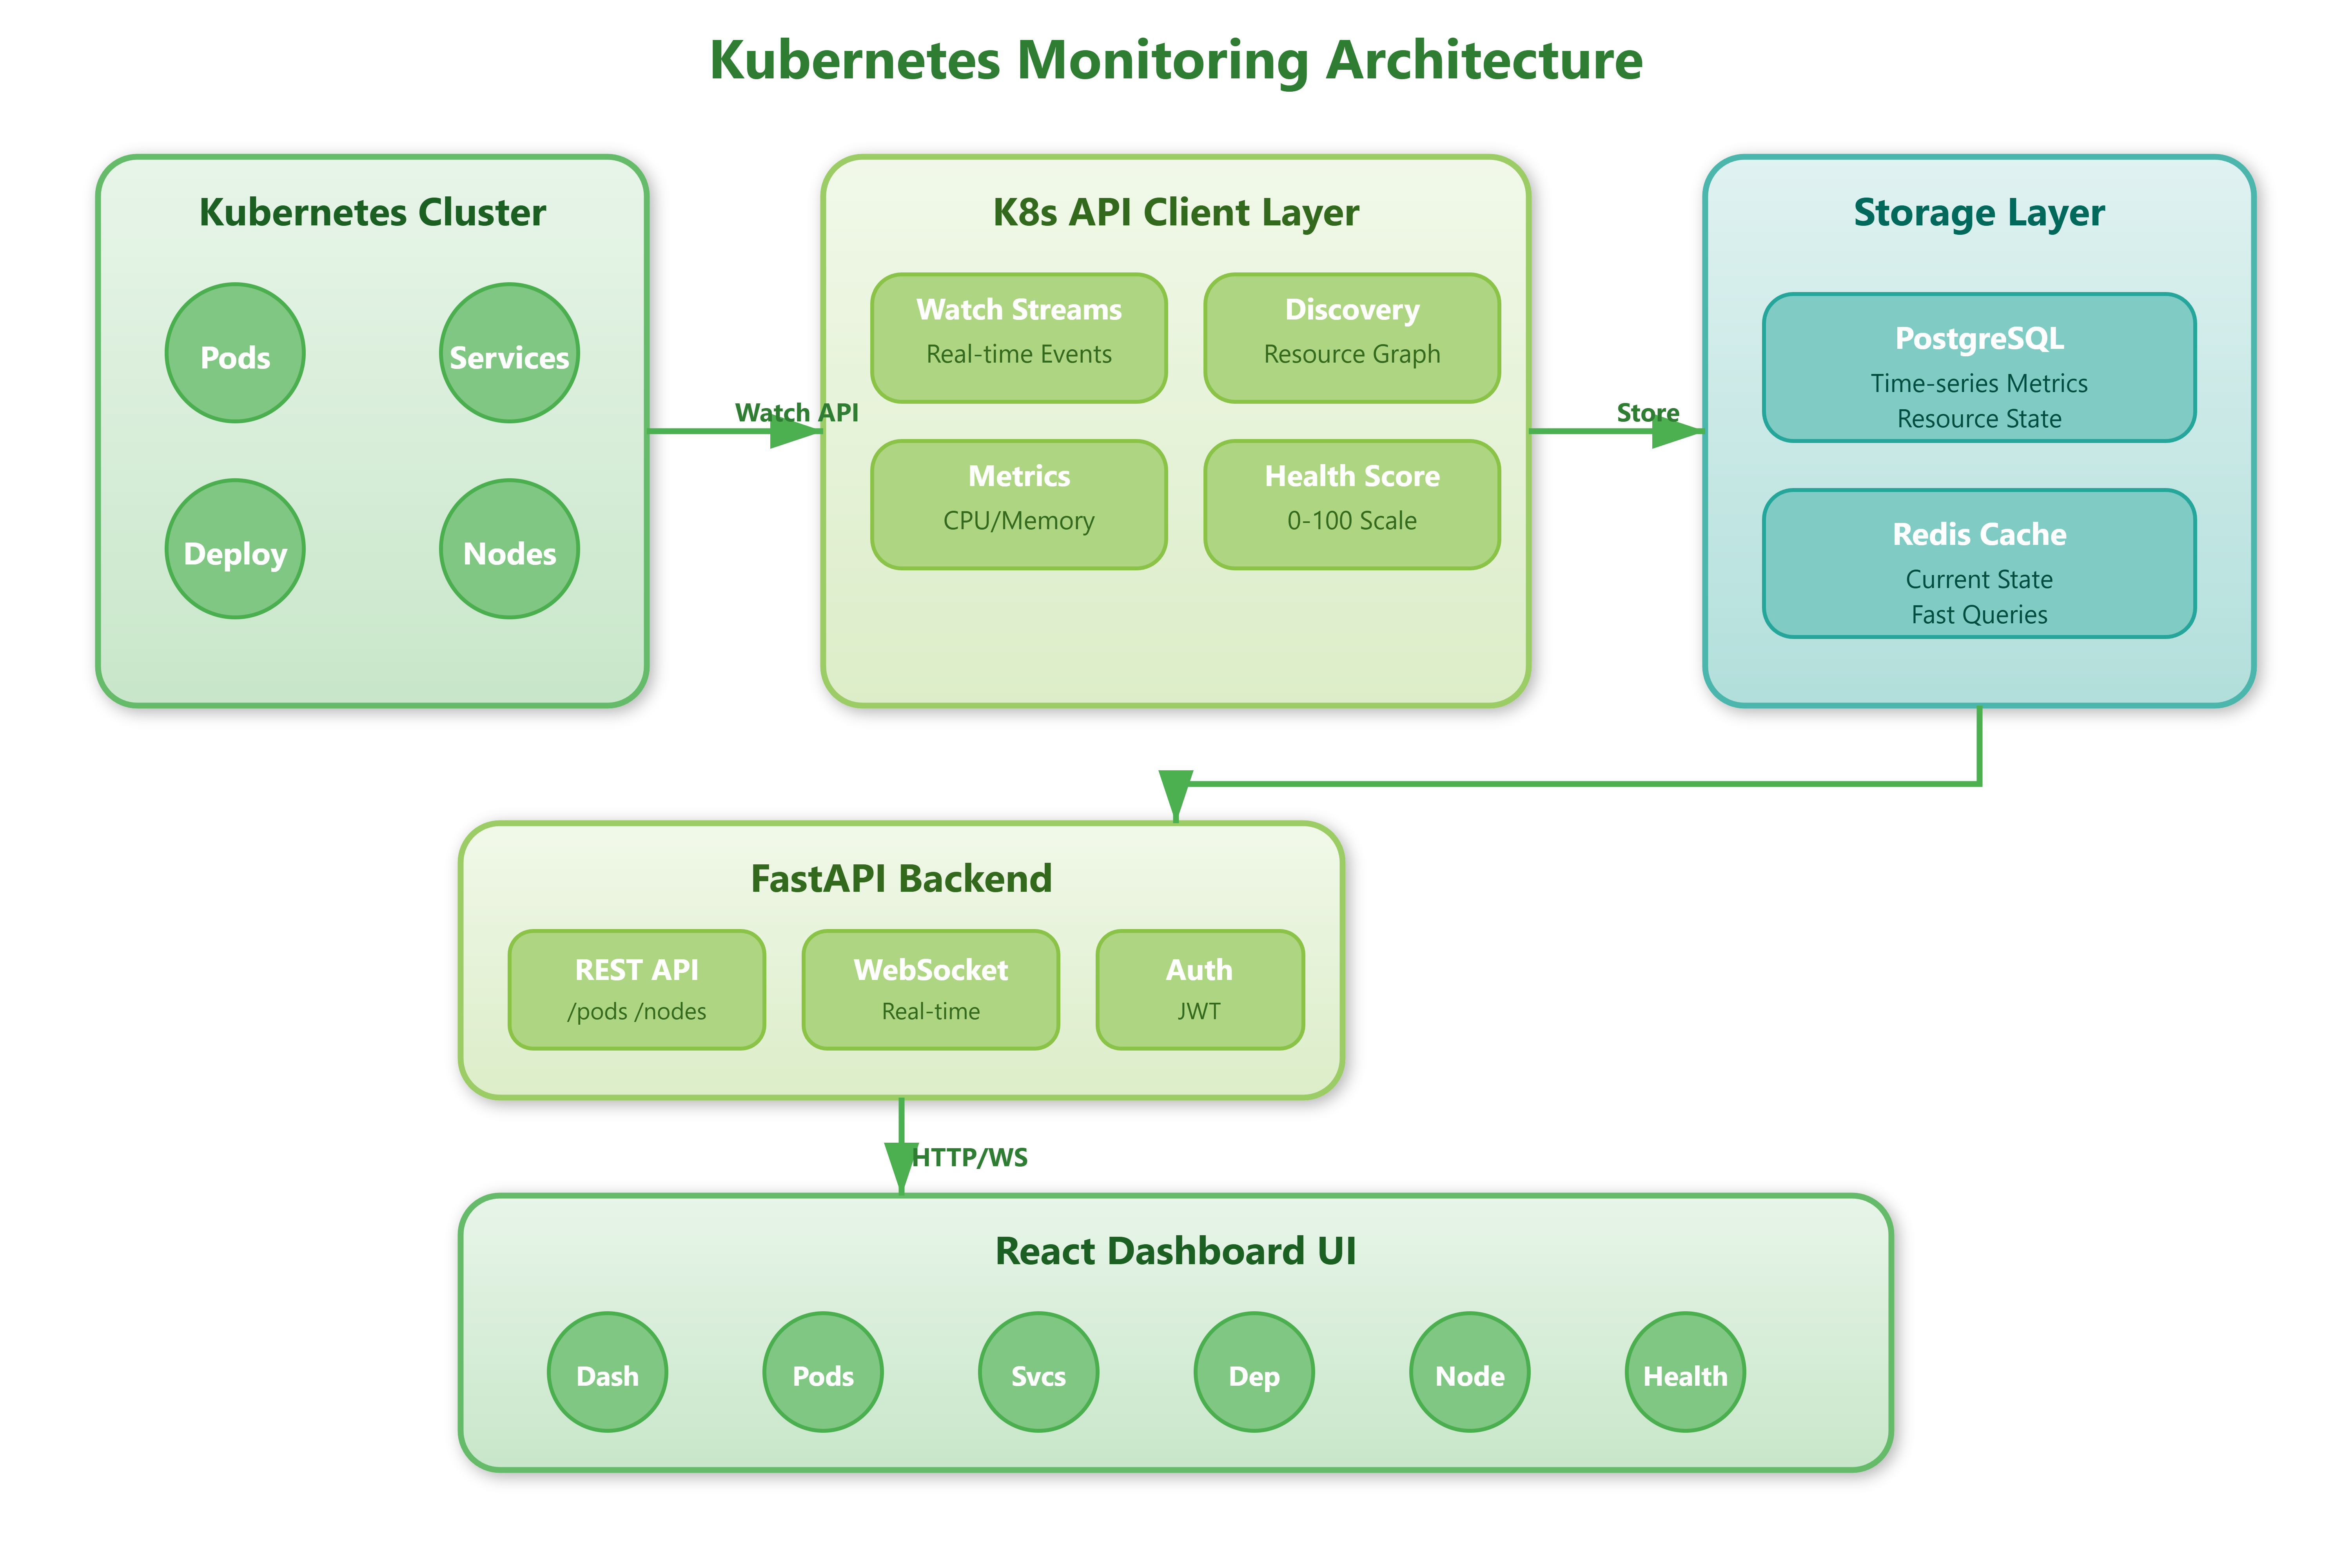
Today we’re extending our infrastructure monitoring platform with Kubernetes integration. You’ll build a production-ready system that monitors cluster health, tracks pod lifecycles, measures resource consumption across namespaces, and provides real-time visibility into deployments and services. This connects directly to yesterday’s container monitoring, creating a complete orchestration-aware observability stack.
What You’ll Implement:
Kubernetes API client with automatic discovery
Real-time pod and service monitoring
Resource utilization tracking (CPU, memory, storage)
Cluster health scoring and alerts
Deployment rollout tracking with versioning
Multi-namespace support with RBAC awareness
Why Kubernetes Monitoring Matters in Production
Every major cloud-native company operates Kubernetes clusters that can scale from dozens to thousands of nodes. Spotify runs 500+ microservices across multiple K8s clusters. Airbnb manages 2,000+ services with millions of pod deployments daily. Without proper monitoring, a failing pod can cascade into service degradation affecting millions of users before anyone notices.
The critical insight: Kubernetes abstracts infrastructure, but that abstraction becomes a blind spot. When a pod crashes and restarts, when deployments roll out incorrectly, when nodes run out of resources—these events happen in milliseconds. Traditional monitoring that polls every 60 seconds misses the critical failure window. Production systems need real-time cluster awareness with sub-second detection.
Companies like Datadog and New Relic built entire product lines around K8s observability because native kubectl commands don’t scale operationally. You can’t have SREs manually checking cluster state across hundreds of environments. This lesson teaches you to build the automation that makes Kubernetes observable at scale.