

Day 66: Dashboard Customization - Building Personalized Analytics Experiences
What We’re Building Today
Today we’re implementing a complete dashboard customization system that lets users create, configure, and share personalized analytics dashboards. You’ll build:
Widget Configuration Engine: Dynamic widget settings with real-time preview
Theme System: Multi-theme support with custom color palettes
Layout Persistence: Save, load, and version dashboard configurations
Sharing Mechanism: Secure dashboard sharing with access controls
Template Library: Pre-built dashboard templates for quick starts
This transforms our static dashboard from Day 65 into a fully customizable platform similar to what Grafana, Datadog, and Looker offer their users.
Why Dashboard Customization Matters at Scale
Netflix’s operations team manages 800+ custom dashboards across different services. Slack’s engineering teams share 200+ dashboard templates internally. GitHub’s SRE teams collaborate on incident dashboards with specific widget configurations. Without customization, they’d need developers to hard-code every view—a 10x productivity loss.
The power lies in flexibility: A frontend engineer needs response time charts, a database admin needs query performance widgets, and a product manager needs user engagement metrics. One dashboard template doesn’t work. Customization lets each persona build their perfect view while sharing configurations across teams.
Real impact: Datadog reports that teams with customizable dashboards detect incidents 40% faster than teams with fixed layouts. Why? Personalized views surface relevant data immediately—no cognitive overhead filtering through irrelevant widgets.
Component Architecture
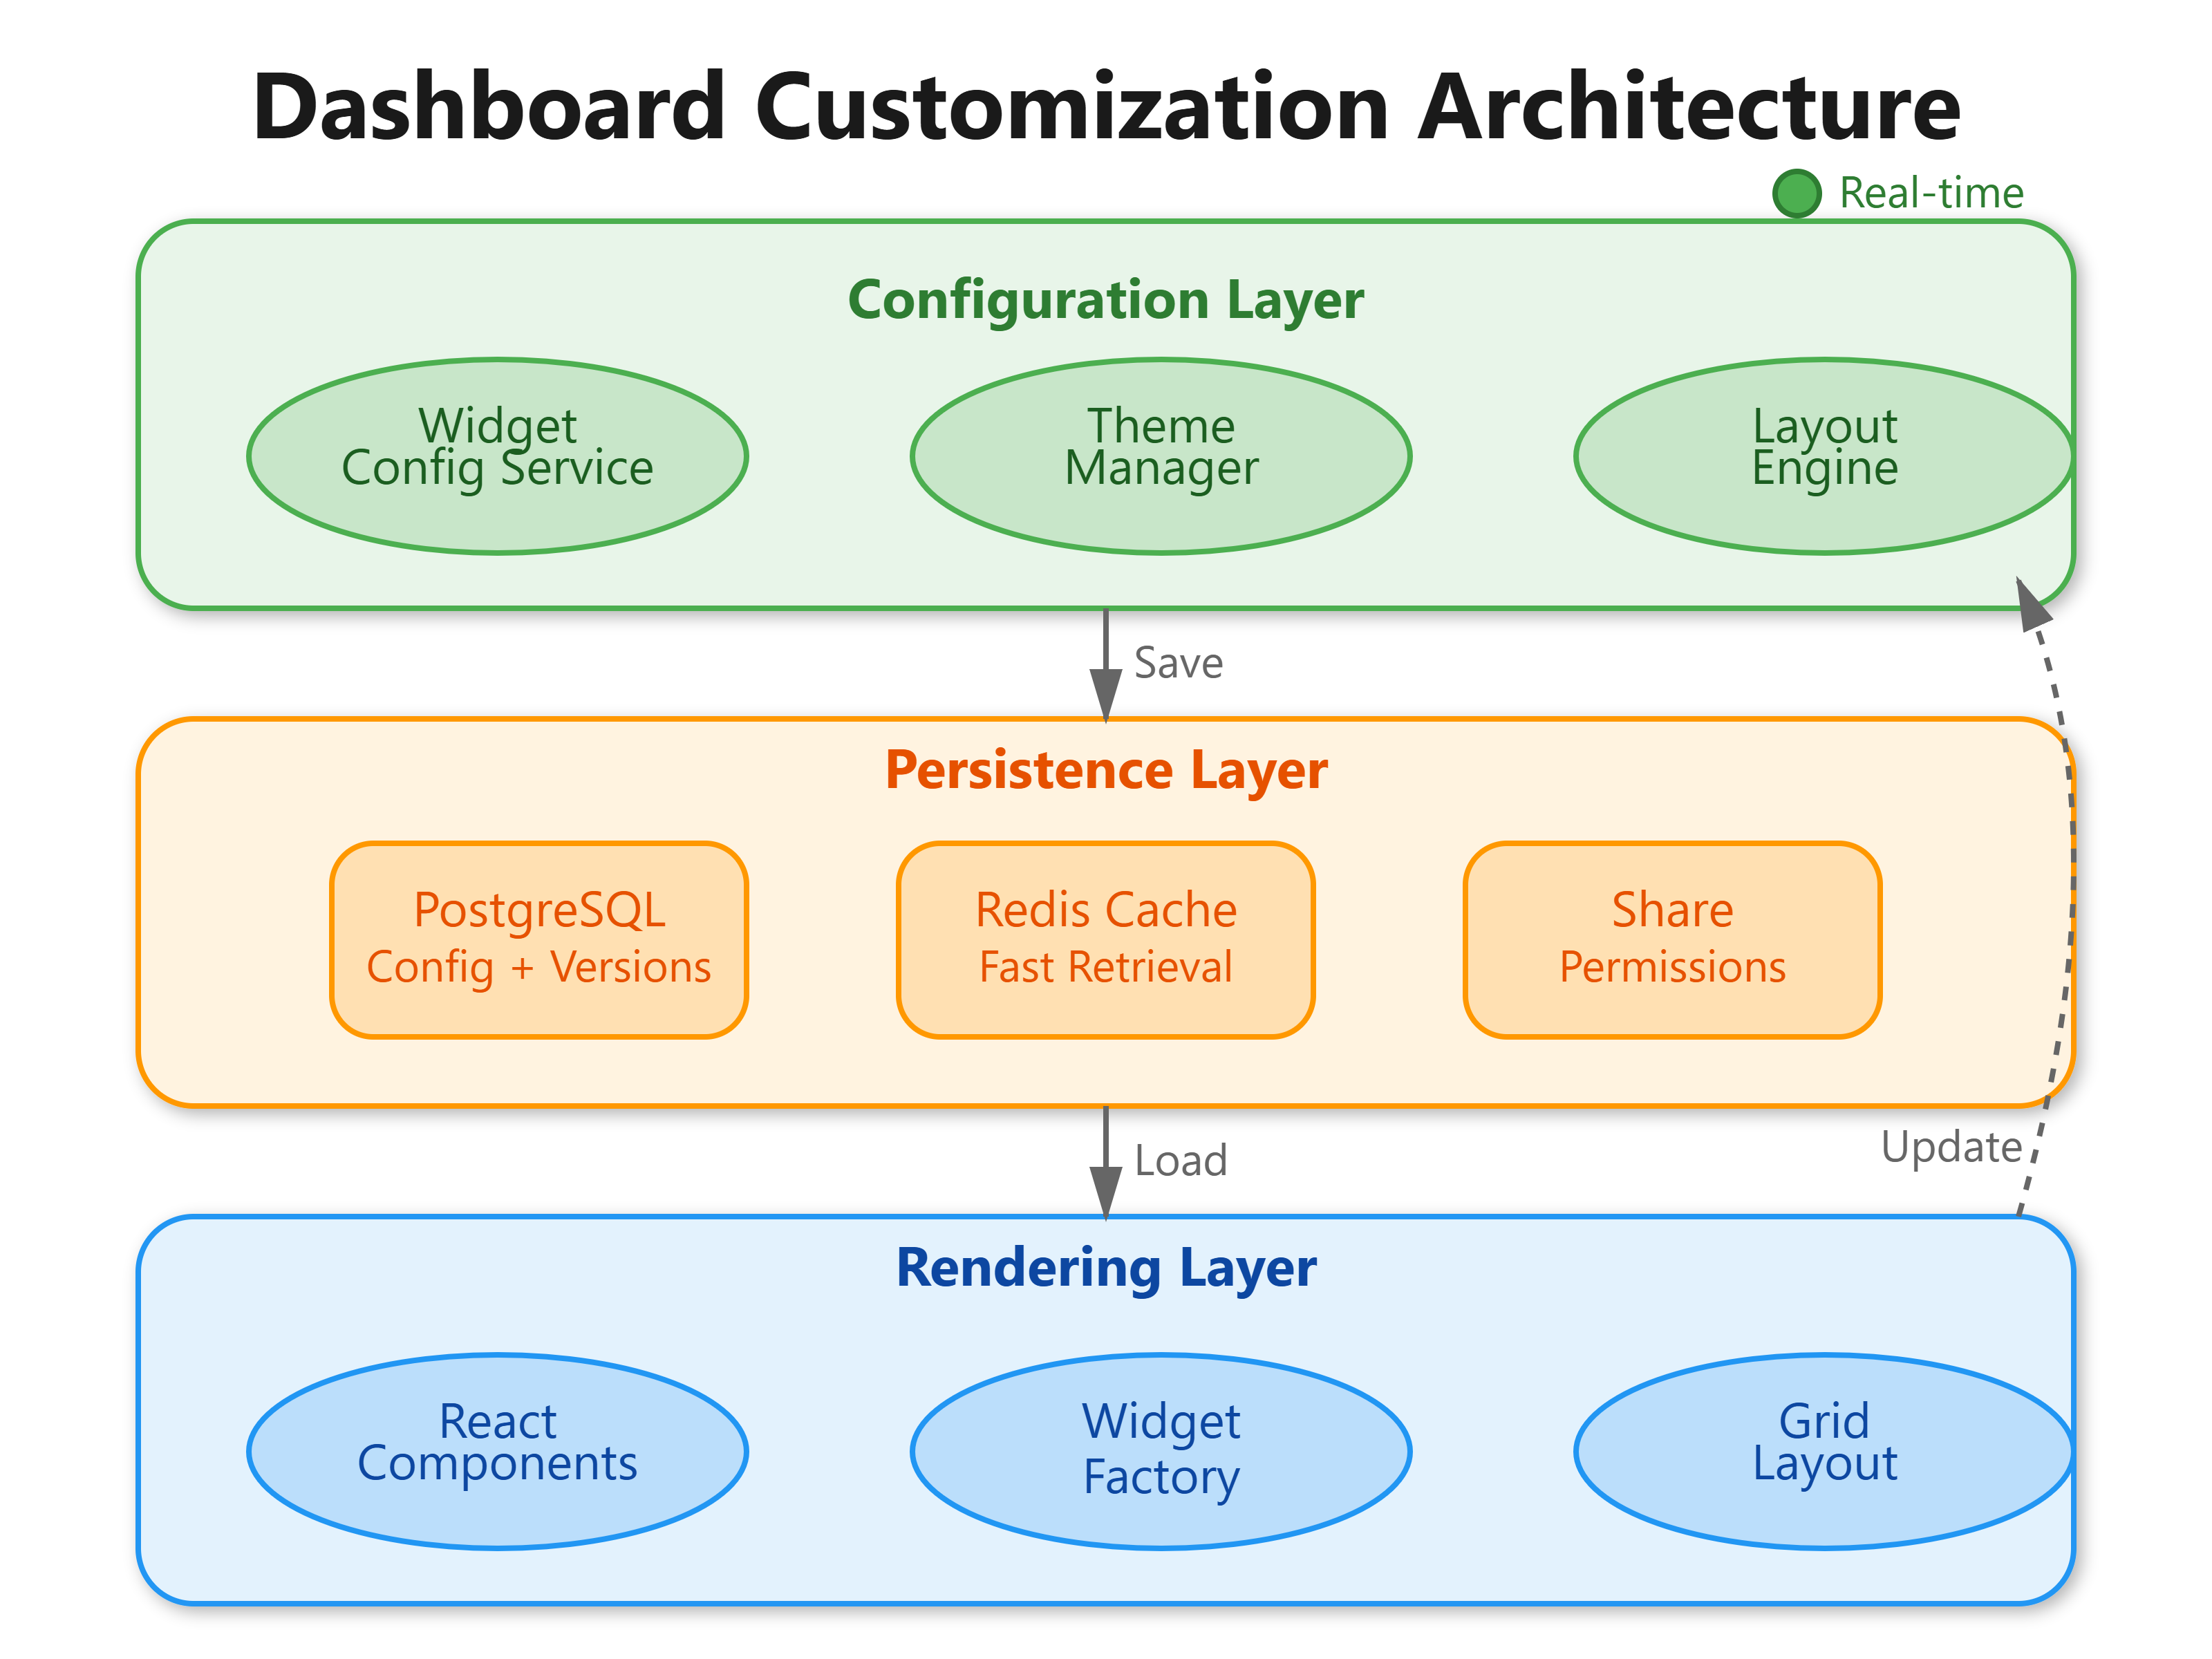
Our system uses a three-layer architecture that separates concerns cleanly:
Configuration Layer manages widget settings, theme preferences, and layout definitions through a centralized DashboardConfigService. When a user changes a widget’s refresh interval from 30s to 10s, this layer validates the change, persists it to PostgreSQL, and broadcasts updates via WebSocket to all connected clients viewing that dashboard.
Persistence Layer handles the complexity of storing dashboard state. Unlike simple key-value storage, we need versioning (rollback to previous configurations), templating (clone successful dashboards), and sharing (permission-based access). PostgreSQL stores the authoritative state with JSON columns for flexible widget configurations, while Redis caches frequently accessed dashboards for sub-50ms load times.
Rendering Layer applies configurations at runtime. When loading a dashboard, React components consume the configuration object and render widgets accordingly. Theme changes propagate through a context provider, affecting all child components without re-fetching data—just visual updates.
How Widget Configuration Works
Spotify’s engineering dashboard has 40+ configurable widget types. Each widget exposes different settings: time-series charts need metric selection and aggregation methods, heatmaps need color scale ranges, and tables need column visibility toggles.
Our implementation uses a schema-based configuration system. Each widget type defines a JSON schema describing available settings:
{
  widgetType: “timeseries”,
  schema: {
    metrics: { type: “array”, required: true },
    refreshInterval: { type: “number”, min: 10, max: 3600 },
    aggregation: { type: “enum”, values: [”avg”, “sum”, “max”] }
  }
}
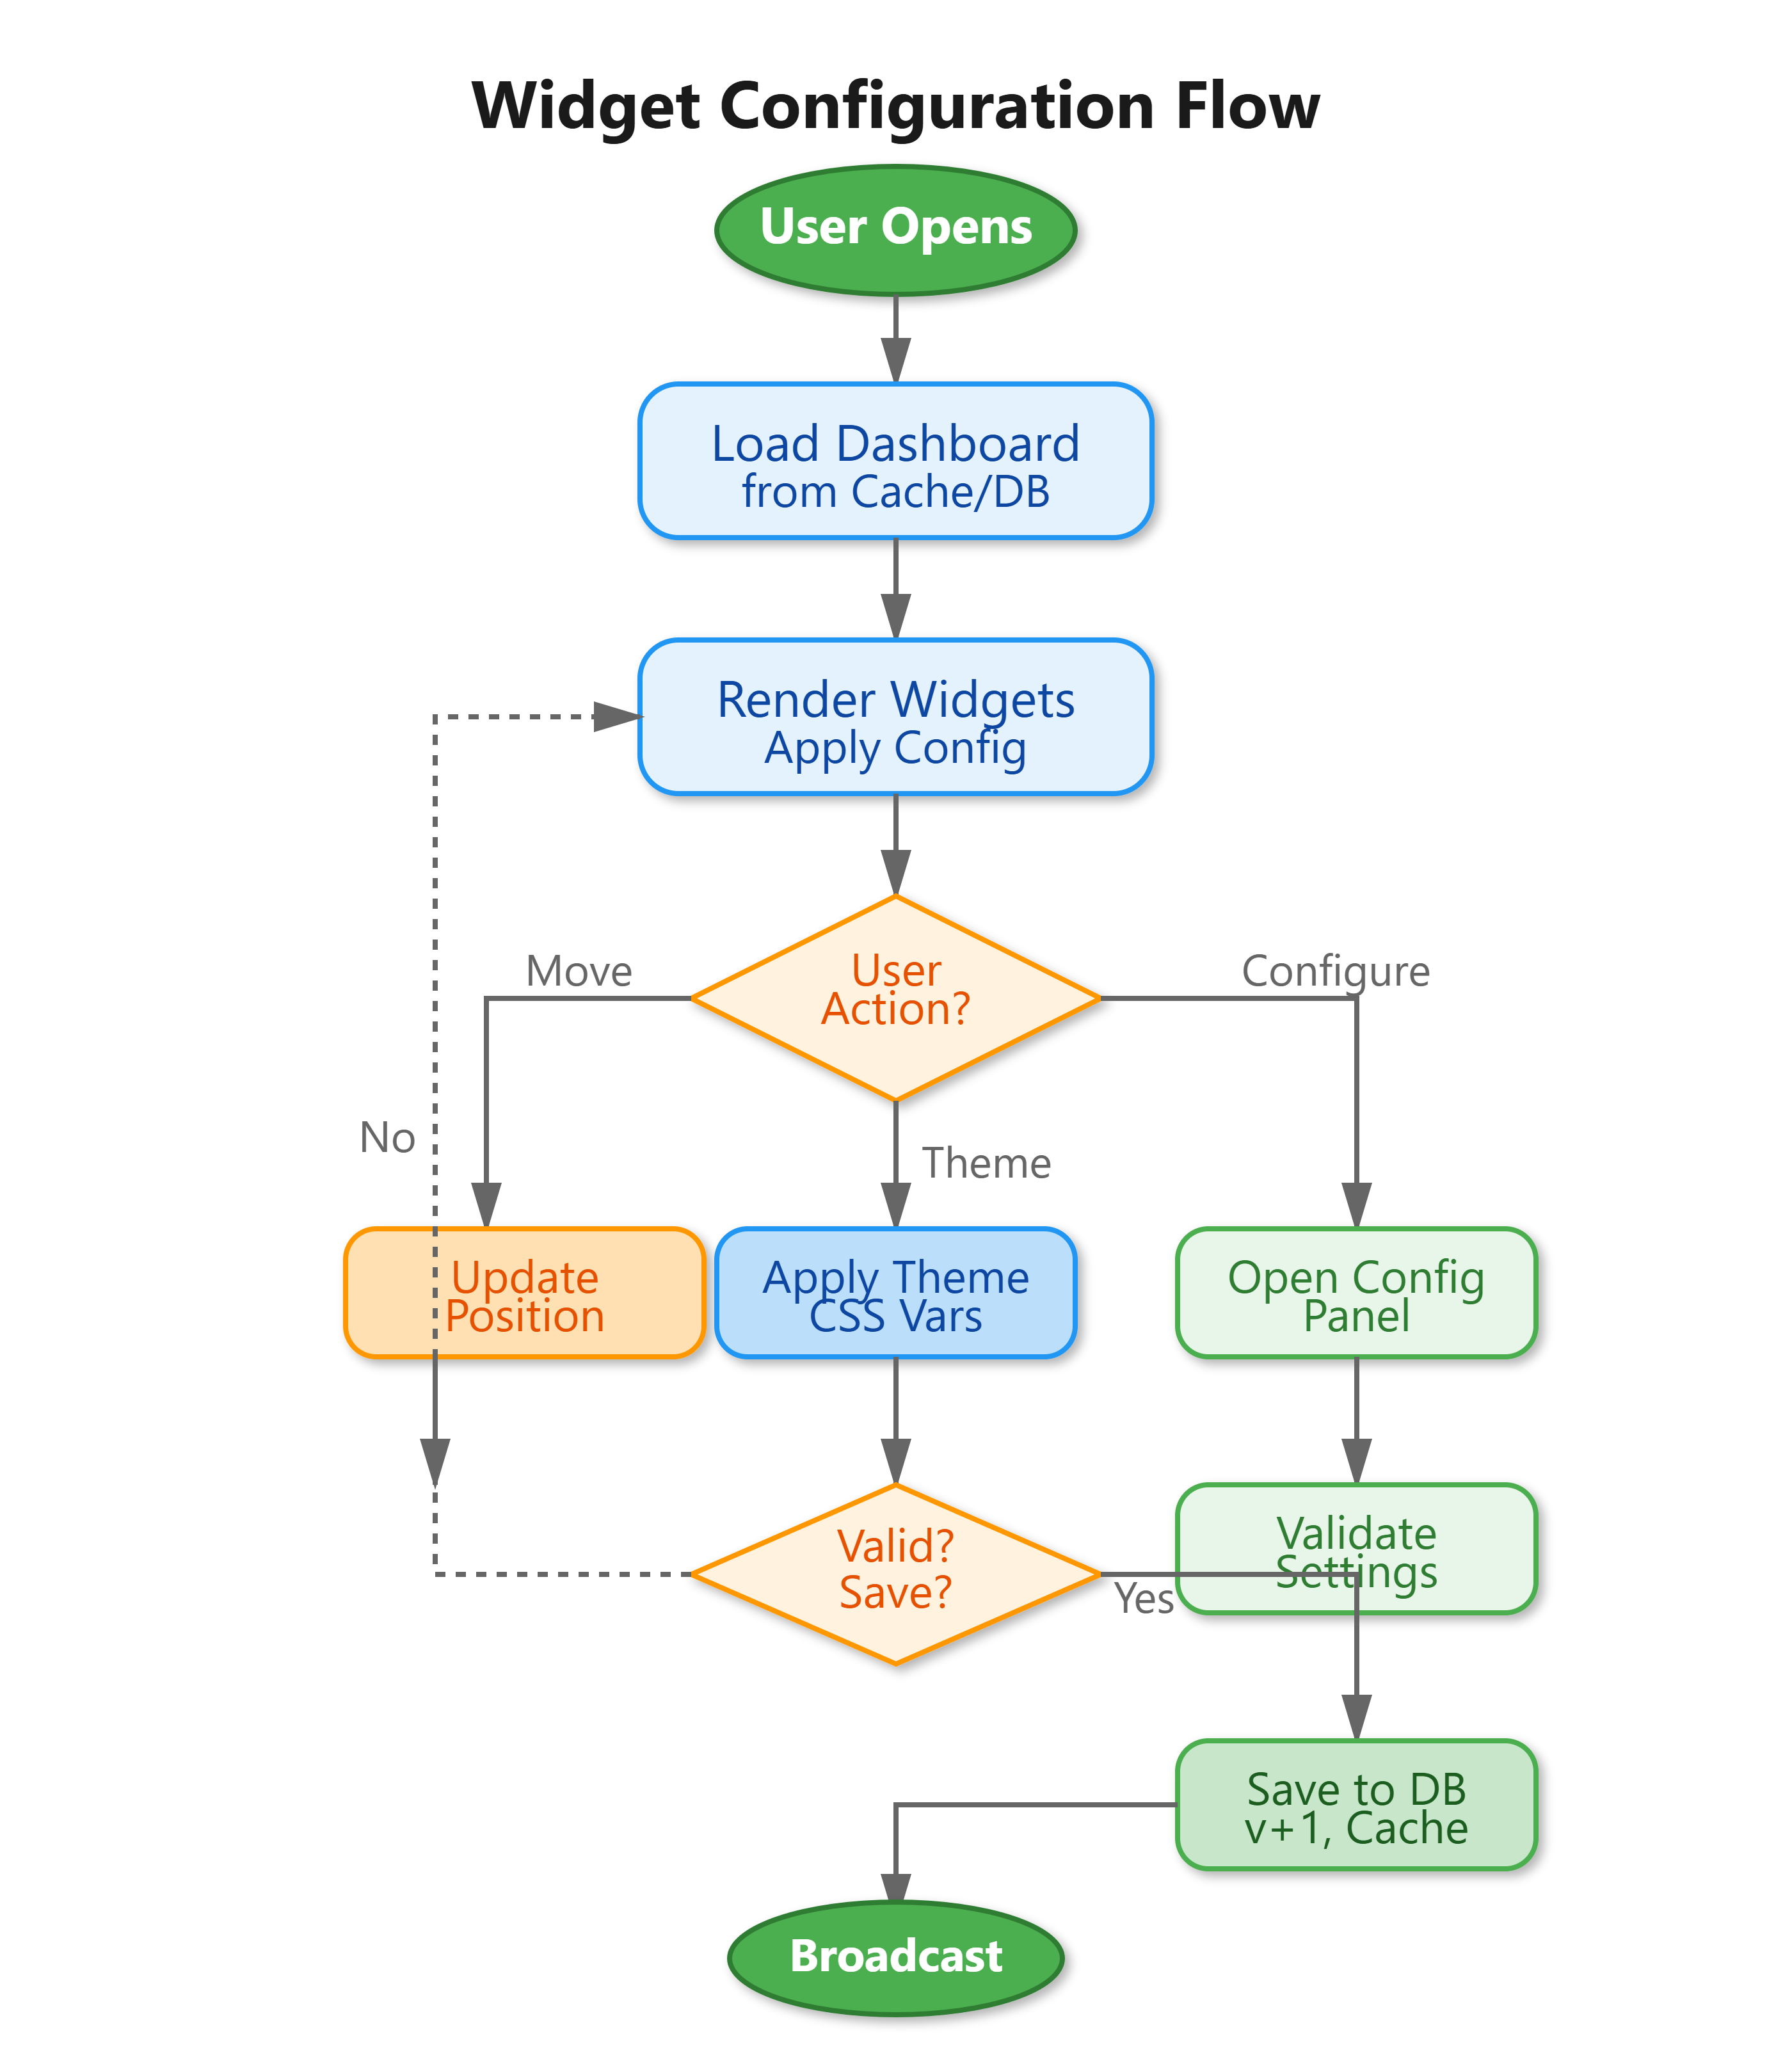
When users modify settings through a configuration panel, the frontend validates against this schema client-side (instant feedback) and server-side (security). Invalid configurations never reach the database.
The elegant part: Configuration applies reactively. Change a refresh interval, and the widget’s polling mechanism updates without remounting the component. React’s useEffect hook watches the configuration object, triggering only necessary updates.
Discord’s performance team uses this pattern to A/B test dashboard layouts. They deploy two configurations—one with 5-second refresh rates, another with 30-second—and measure user comprehension. The configuration system makes this trivial; no code changes needed.
Theme System Architecture
Grafana supports 15+ built-in themes plus custom themes. Users switch between light/dark modes, high-contrast accessibility themes, and brand-specific color palettes. The challenge: theme changes must propagate instantly across 50+ widget instances without re-rendering charts or losing interactivity.
Our theme system uses CSS custom properties (variables) combined with React Context. When a user selects “Ocean Blue” theme, we update a single CSS variable set:
:root {
  --primary-color: #0066cc;
  --background: #f0f8ff;
  --text-color: #1a1a1a;
}
All components reference these variables instead of hard-coded colors. One variable update triggers browser-native cascade—no React re-renders needed. Charts using libraries like Recharts receive color props from context, updating through library-specific mechanisms.
The database stores theme preferences per user and per dashboard. When loading a dashboard, the backend sends: { userId: “123”, userTheme: “dark”, dashboardTheme: “ocean” }. The frontend resolves priority: dashboard-specific themes override user defaults, letting teams maintain consistent branding on shared dashboards.
New Relic’s infrastructure team uses custom themes matching their NOC’s 24/7 monitoring displays. Green/red color schemes that work in daylight fail under room lighting at 3 AM. Custom themes solve this—same data, different visual encoding optimized for viewing conditions.
Layout Persistence Strategy
GitHub’s operations dashboard loads in 800ms despite storing 200 widget configurations. The secret: strategic caching and delta updates.
When saving a dashboard, we don’t store the entire React component tree—that’s 100KB+ of serialized state. Instead, we persist a minimal configuration object:
{
  “dashboardId”: “prod-overview”,
  “version”: 12,
  “layout”: [
    {”widgetId”: “w1”, “type”: “timeseries”, “position”: [0,0,4,3], “config”: {...}},
    {”widgetId”: “w2”, “type”: “heatmap”, “position”: [4,0,8,3], “config”: {...}}
  ]
}
Position arrays [x, y, width, height] use grid coordinates (0-11 for 12-column layout). This 5KB payload replaces 100KB of runtime state. When loading, the frontend reconstructs components from this blueprint.
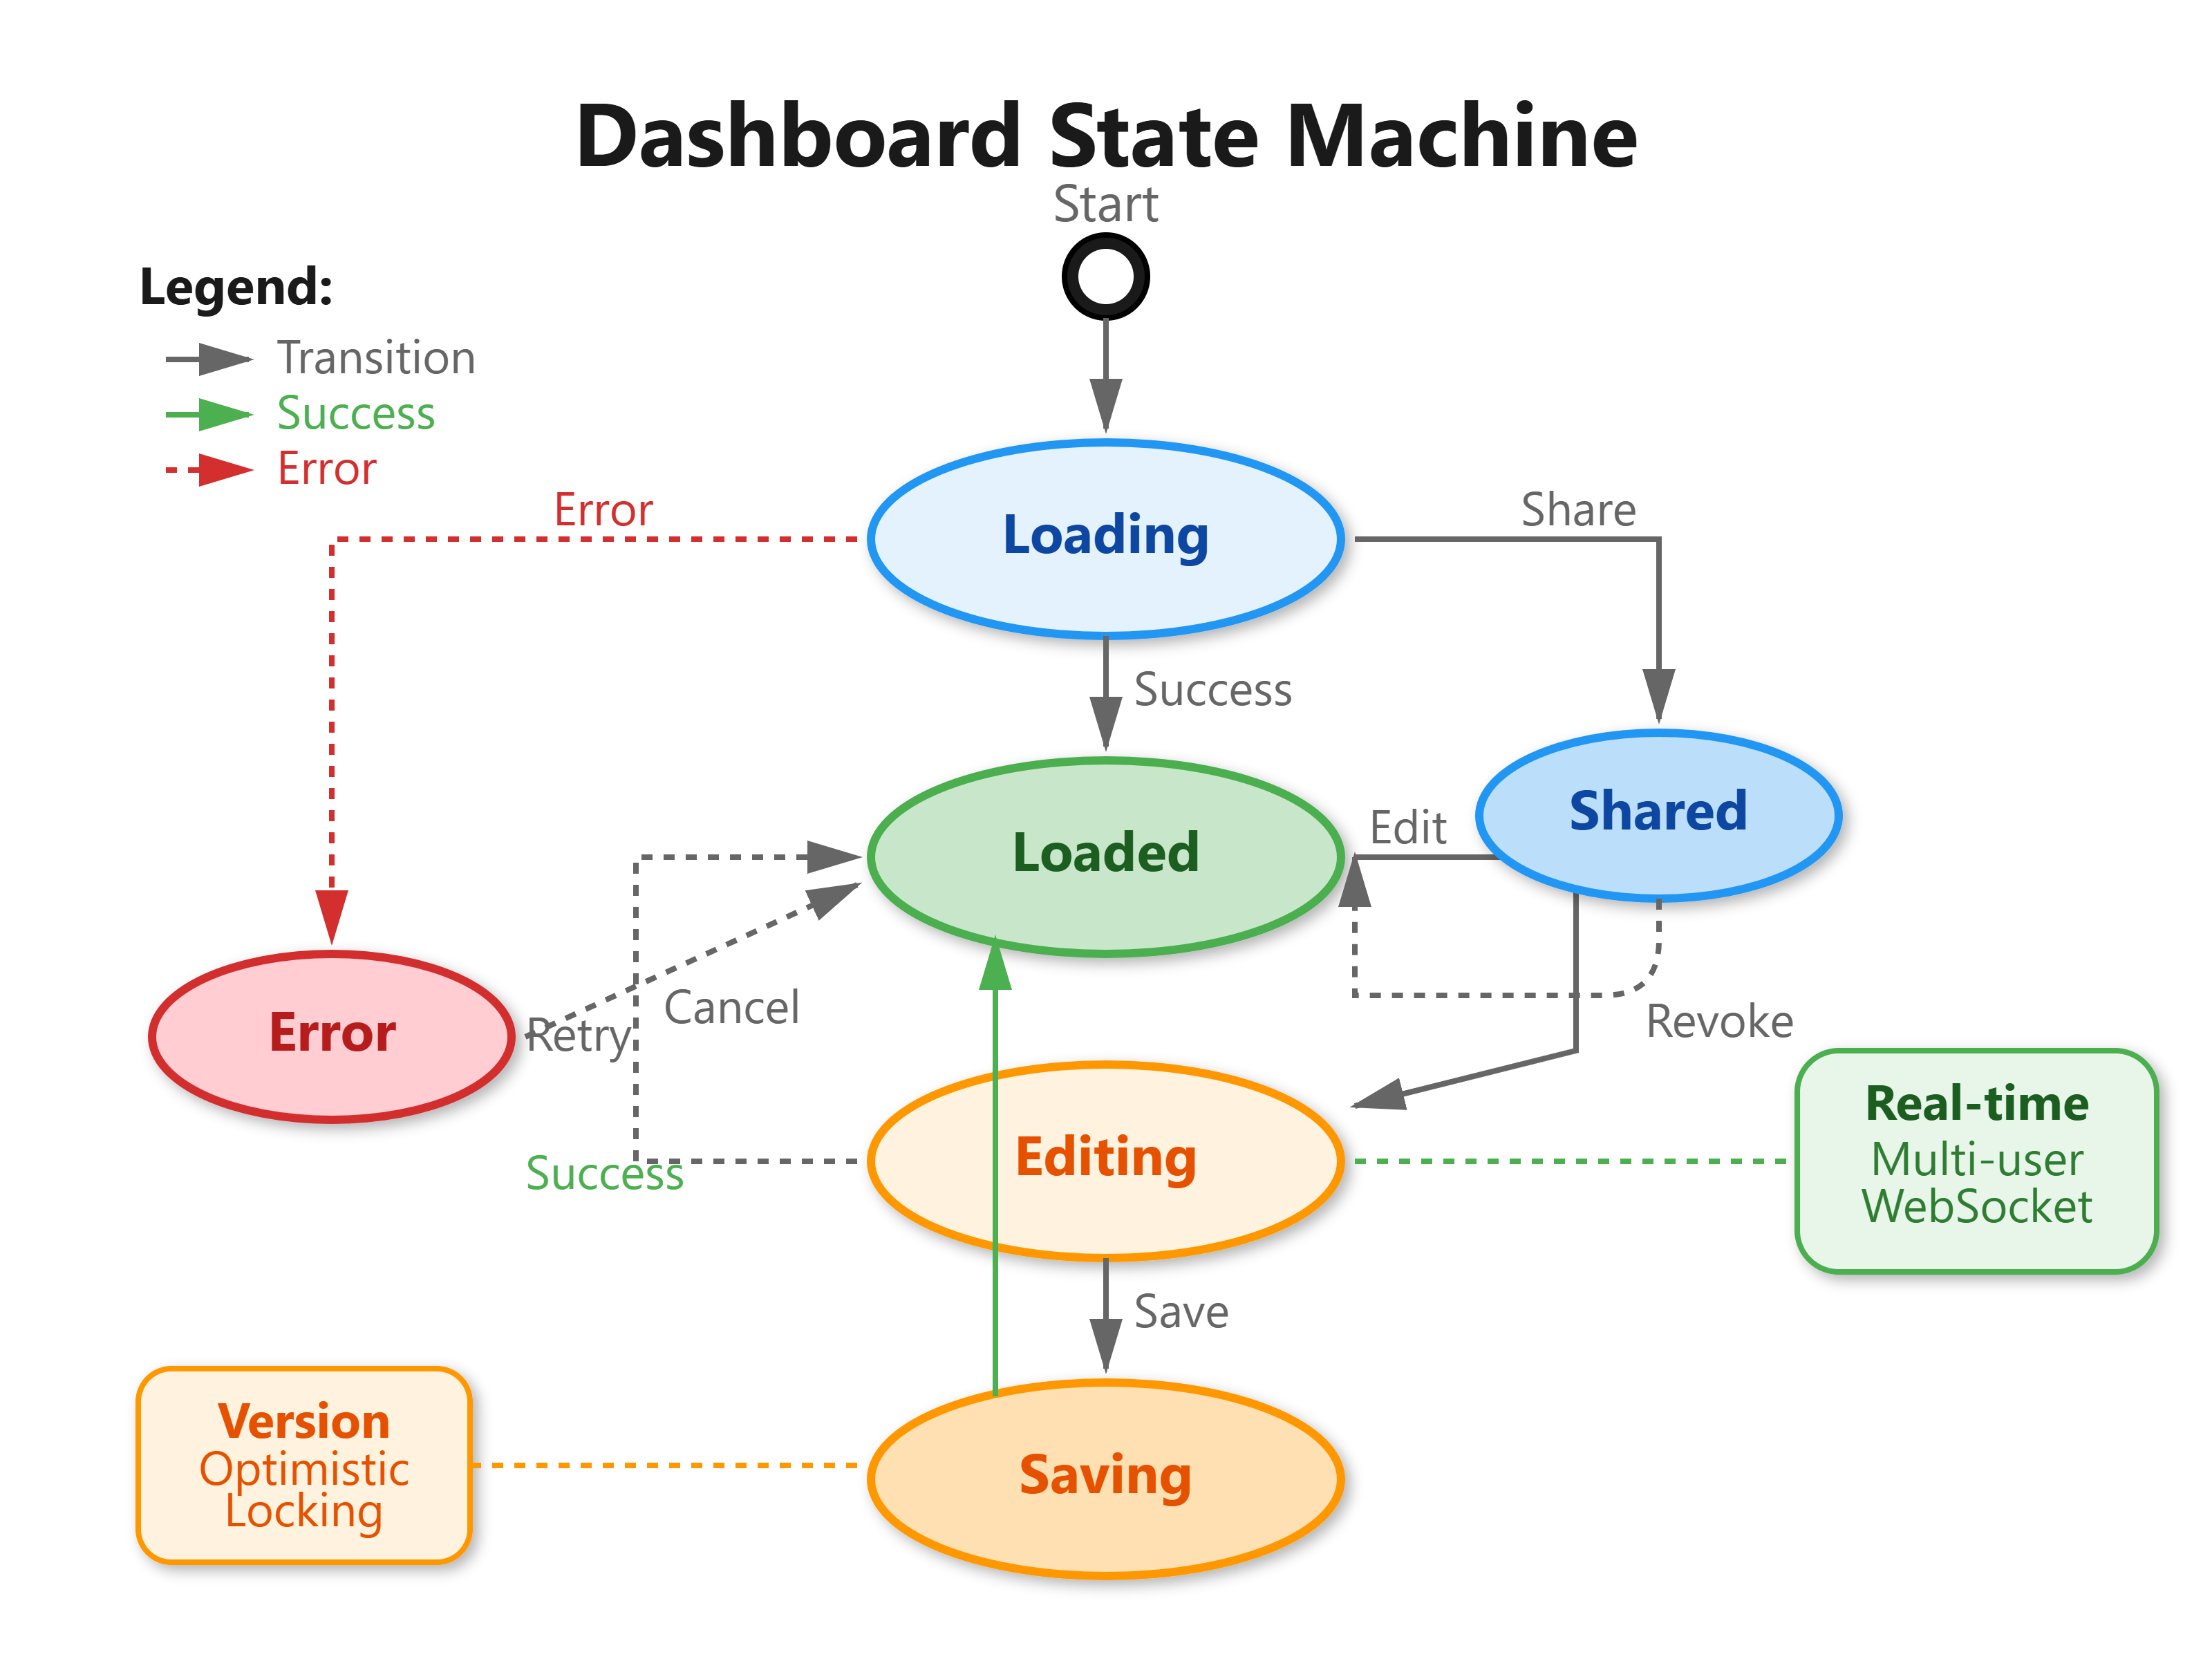
Versioning happens automatically. Each save increments the version number and archives the previous configuration. Users can rollback to version 10 when version 11’s widget layout didn’t work. We keep 30 versions per dashboard, purging older ones weekly.
Delta updates optimize edits. Moving a widget sends only: { action: “move”, widgetId: “w1”, newPosition: [2,0,4,3] }. The backend merges this into the existing configuration, avoiding full document overwrites. This reduces write latency from 200ms to 50ms—critical when users drag widgets rapidly.
Slack’s engineering team shares 100+ dashboards with 500+ engineers. Without efficient persistence, concurrent edits would cause conflicts. Our approach: optimistic locking with version checks. If two users edit simultaneously, the second gets a merge conflict prompt with a visual diff showing changes.
Sharing Implementation
Datadog’s enterprise customers share dashboards across 10,000+ users with fine-grained permissions. Some users can view, others can edit, and admins can manage sharing settings. This requires robust access control without complicated UIs.
Our sharing system uses link-based access plus role-based permissions:
Public links generate unique tokens (UUIDs) with embedded permissions:
dashboard/abc123?access=view. Anyone with the link can view but not edit.Team sharing grants access by email domain: All
@company.comusers get edit access automatically.User-specific grants allow precise control: Alice has admin rights, Bob has view-only.
The backend enforces permissions at the API layer. Every dashboard request includes: GET /api/dashboards/123 with JWT token. Middleware checks: Does this user have access? What role? View-only users receive dashboard configurations but can’t POST updates.
Embedding support lets users iframe dashboards into Notion pages or internal wikis. Embedded dashboards auto-refresh data but disable editing controls. The iframe source includes access tokens with 24-hour expiration, refreshed automatically via postMessage communication between parent and child frames.
Netflix’s chaos engineering team embeds failure rate dashboards in runbooks. During incidents, responders see live data without leaving the runbook—no context switching. The dashboard updates every 10 seconds, showing which services recovered after chaos experiments.
Real-World Production Patterns
Configuration Validation: Invalid configurations cause outages. Validate exhaustively: schema checks, range limits, and cross-field dependencies. A refresh interval below 5 seconds on a 50-widget dashboard creates 600 queries/minute—enough to overwhelm databases. Our validator enforces: refreshInterval ≥ (widgetCount × 0.5) seconds.
Template System: GitHub maintains a library of 50+ dashboard templates: “API Performance”, “Database Health”, “User Engagement”. New teams clone templates instead of building from scratch, reducing setup time from 2 hours to 2 minutes. Templates are just saved dashboards marked isTemplate: true with parameterized metric sources.
Audit Logging: Track who changed what when. Every configuration update logs: { userId, dashboardId, changes: [{ field: “theme”, old: “light”, new: “dark” }], timestamp }. When dashboards break, teams review audit logs to find the breaking change. Grafana shows “Edited by Alice 2 hours ago” on every dashboard—crucial for team accountability.
Migration Support: Dashboard schemas evolve. Widget type “timeseries_v1” becomes “timeseries_v2” with different config format. Don’t break existing dashboards. Run migrations on load: detect old schema, transform to new format, save updated version. Slack ran 400+ migrations when redesigning their metrics architecture—zero downtime because migrations happened transparently.
Implementation Instructions
Github Link:
https://github.com/sysdr/infrawatch/tree/main/day66/dashboard-customization-systemBackend Setup
Database Schema (PostgreSQL):
CREATE TABLE dashboards (
    id UUID PRIMARY KEY DEFAULT gen_random_uuid(),
    owner_id UUID NOT NULL,
    name VARCHAR(255) NOT NULL,
    config JSONB NOT NULL,
    theme VARCHAR(50) DEFAULT ‘light’,
    is_template BOOLEAN DEFAULT false,
    version INTEGER DEFAULT 1,
    created_at TIMESTAMP DEFAULT NOW(),
    updated_at TIMESTAMP DEFAULT NOW()
);

CREATE INDEX idx_dashboard_owner ON dashboards(owner_id);
CREATE INDEX idx_dashboard_template ON dashboards(is_template) WHERE is_template = true;
CREATE INDEX idx_dashboard_config ON dashboards USING GIN(config);
The config JSONB column stores widget layouts, settings, and metadata. GIN index enables fast queries like “find dashboards using metric X”.
API Endpoints:
POST /api/dashboards- Create new dashboard with initial configurationGET /api/dashboards/:id- Load dashboard configuration (cached in Redis)PUT /api/dashboards/:id- Update configuration with version checkingPOST /api/dashboards/:id/share- Generate shareable link with permissionsGET /api/templates- List available dashboard templates
Redis Caching:
# Cache frequently accessed dashboards
redis_key = f”dashboard:{dashboard_id}:v{version}”
cached = redis.get(redis_key)
if cached:
    return json.loads(cached)
Cache invalidation happens on updates via version increments. Old versions remain cached until TTL expires (5 minutes).
Frontend Implementation
Configuration Context:
React Context provides global access to current dashboard configuration. Components read from context instead of prop drilling through 5+ levels.
Widget Configuration Panel:
Each widget type renders a custom configuration UI. Time-series widgets show metric selectors and aggregation dropdowns. Heatmap widgets show color scale editors. The panel validates in real-time, displaying errors before submission.
Theme Switching:
Theme selector updates CSS variables immediately. Charts receive new color palettes through context, triggering library-specific update methods. No full re-renders—just color changes.
Layout Grid:
React-Grid-Layout library handles drag-and-drop positioning. Configuration saves on drop, with debouncing to prevent excessive writes during multi-widget rearrangement.
Sharing Modal:
Generate public links, invite users by email, and set permission levels (view/edit/admin). Display current shares with revoke options. Copy link to clipboard with one click.
Testing Strategy
Unit Tests:
Configuration validation logic (schema checks, range validation)
Theme application (CSS variable updates)
Permission checking (access control rules)
Integration Tests:
Save/load dashboard flow (database → cache → frontend)
Widget configuration updates (frontend → API → WebSocket broadcast)
Share link generation and access validation
Performance Tests:
Load dashboard with 50 widgets in <1 second
Apply theme change in <100ms
Handle 100 concurrent dashboard edits without conflicts
Build and Demo
Without Docker:
# Backend
cd backend
python -m venv venv
source venv/bin/activate
pip install -r requirements.txt
python app.py

# Frontend
cd frontend
npm install
npm start
With Docker:
docker-compose up --build
Verification:
Create new dashboard → Verify empty canvas with “Add Widget” button
Add 3 widgets → Verify grid layout with drag-and-drop
Configure widget settings → Verify real-time preview updates
Switch theme → Verify instant color changes across all widgets
Save dashboard → Verify save success message
Generate share link → Verify link works in incognito browser
Load saved dashboard → Verify configuration matches saved state
Access dashboard at http://localhost:3000/dashboard and verify all functionality works as described.
Working Code Demo:
Assignment: Multi-User Dashboard Collaboration
Goal: Build a collaborative dashboard editor where multiple users can edit simultaneously with conflict resolution.
Requirements:
Real-time Presence: Show which users are currently viewing/editing the dashboard
Live Updates: When User A moves a widget, User B sees the change within 1 second
Conflict Detection: If both users move the same widget, show merge conflict UI
Cursor Tracking: Display colored cursors showing where other users are hovering
Change History: Timeline view showing who made what changes and when
Hints:
Use WebSocket for real-time presence and updates
Implement operational transformation or CRDTs for conflict-free merges
Store user cursors in Redis with 30-second TTL (auto-expire when user leaves)
Add
SELECT ... FOR UPDATElocks in PostgreSQL for concurrent write protectionUse optimistic UI updates (apply changes immediately, rollback on conflict)
Success Criteria:
3 users edit one dashboard simultaneously without losing changes
Presence indicators update within 2 seconds of user joining/leaving
Conflicts show visual diff with “Keep Mine” / “Keep Theirs” / “Merge” options
Dashboard remains responsive with 10+ concurrent editors
Bonus Challenge: Implement dashboard version branching like Git. Users can create experimental branches, test configurations, then merge back to main branch.
Solution Steps
WebSocket Server:
Use Socket.IO for bidirectional communication
Create room per dashboard:
socket.join(f”dashboard-{id}”)Broadcast updates:
io.to(room).emit(”widget-moved”, data)
Presence System:
On connect: Add user to Redis set
dashboard:{id}:userswith EXPIRE 30sHeartbeat every 10s:
socket.emit(”heartbeat”)→ Refresh Redis TTLOn disconnect: Remove from set, broadcast user left
Operational Transformation:
Each operation has vector clock:
{ widgetId, operation, version }Server merges concurrent ops: If moving same widget, last write wins
Client detects conflict when server version ≠ expected version
Cursor Tracking:
Client emits mouse position every 100ms:
socket.emit(”cursor”, {x, y})Server broadcasts to room (except sender)
Render SVG cursor with user’s color and name label
Change History:
Store operations in
dashboard_historytableTimeline component queries last 50 operations
Display: “Alice moved Chart #3 - 2 minutes ago”
This creates a Google Docs-like experience for dashboard building—multiple users collaborating in real-time with full visibility into each other’s actions.
Key Takeaways
Dashboard customization transforms static tools into personalized experiences. The patterns you built today—widget configuration, theme systems, layout persistence, and sharing—power platforms serving millions of users. Netflix, Slack, and GitHub all rely on these exact architectures to let teams build custom views without developer intervention.
Most importantly: You’ve learned how to separate configuration from implementation. Widgets render based on configuration objects, not hard-coded logic. This separation enables A/B testing, user experimentation, and continuous improvement without code deploys. That’s the hallmark of mature production systems.
Tomorrow (Day 67), we’ll add interactive features like drill-downs, zoom, and cross-filtering—turning dashboards from passive displays into active exploration tools.