

Day 54: Real-time Testing
Building Production-Grade WebSocket Test Suites
What We’re Building Today
Today you’ll construct a comprehensive testing infrastructure for WebSocket systems that mirrors what engineering teams at Slack, Discord, and Zoom use to ensure their real-time features never fail under pressure. You’ll build:
A complete WebSocket testing suite with unit, integration, and stress tests
Load testing framework capable of simulating 10,000+ concurrent connections
Concurrency testing scenarios for race conditions and deadlocks
Performance benchmarking with latency percentiles and throughput metrics
Reliability testing under network chaos and resource constraints
By lesson’s end, you’ll have a testing system that can validate your Day 53 performance optimizations actually work at scale.
Why Real-time Testing Matters
Netflix runs over 1 million WebSocket load tests daily before deploying changes to their streaming infrastructure. Discord’s testing suite catches 94% of production issues before they reach users. The pattern is clear: companies with excellent real-time experiences invest heavily in testing infrastructure.
Testing WebSocket systems differs fundamentally from REST API testing. You’re dealing with persistent connections, bidirectional message flows, connection state management, and timing-dependent behaviors. A test that passes at 10 connections might fail catastrophically at 1,000.
Core Architecture: The Testing Pyramid for Real-time Systems
Your WebSocket testing architecture follows a modified testing pyramid with four layers:
Unit Tests (Base Layer): Test individual message handlers, serializers, and connection managers in isolation. These run in milliseconds and catch logic errors early.
Integration Tests (Second Layer): Test WebSocket endpoints with actual connections but controlled environments. Verify message routing, authentication, and protocol compliance.
Load Tests (Third Layer): Simulate realistic traffic patterns with hundreds to thousands of concurrent connections. Measure throughput, latency distributions, and resource consumption.
Chaos Tests (Top Layer): Inject failures—network partitions, server crashes, memory pressure—to verify graceful degradation and recovery.
Component Deep Dive
WebSocket Test Client
The foundation of your testing suite is a robust test client that can establish connections, send/receive messages, and collect metrics:
class WebSocketTestClient:
    async def connect(self, url, headers=None)
    async def send(self, message)
    async def receive(self, timeout=5.0)
    async def close(self)
    def get_metrics(self) -> ConnectionMetrics
This client tracks connection establishment time, message round-trip latency, bytes transferred, and error counts.
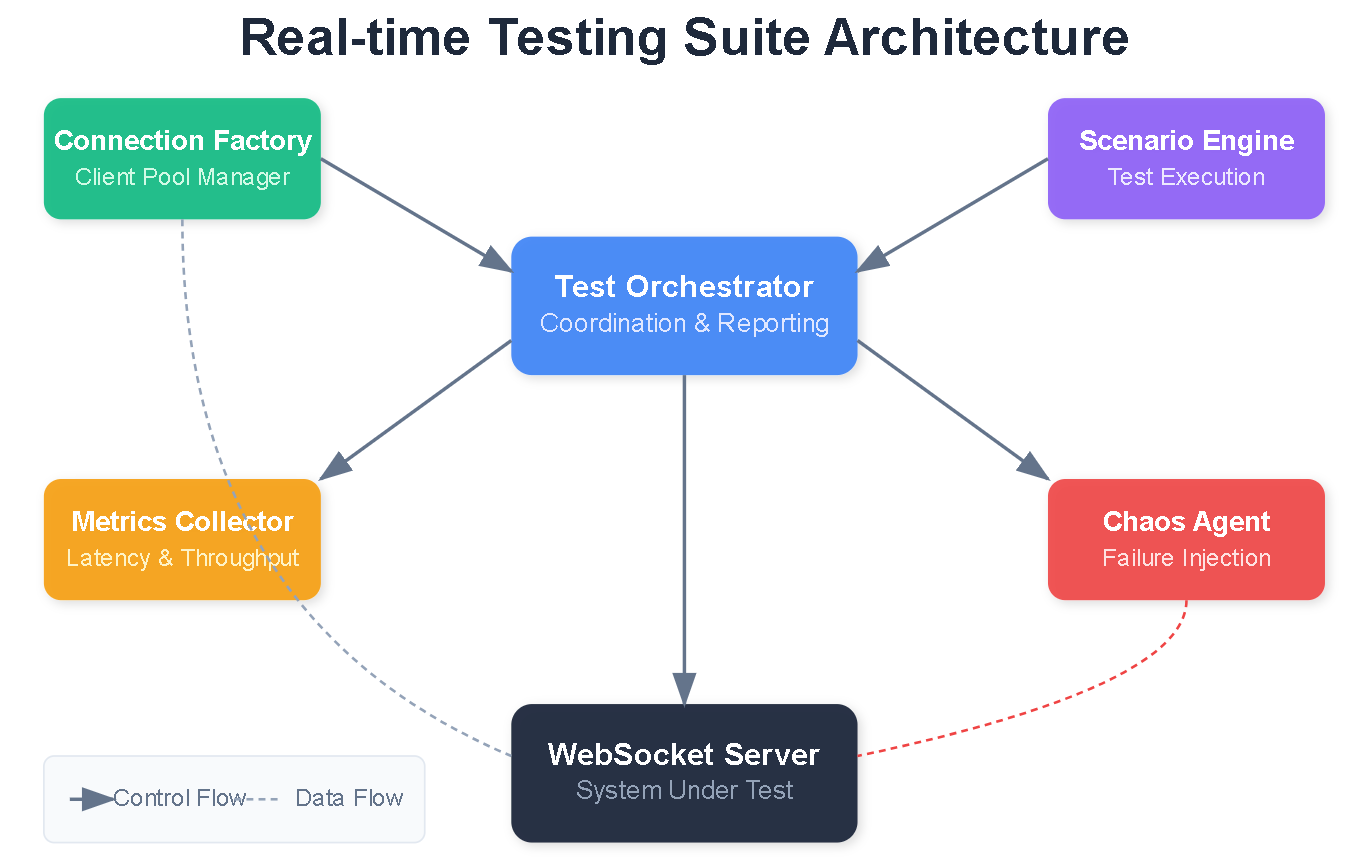
Load Test Orchestrator
The orchestrator manages thousands of test clients simultaneously, coordinating connection ramps, message patterns, and metric collection:
class LoadTestOrchestrator:
    async def spawn_connections(self, count, ramp_rate)
    async def execute_scenario(self, scenario)
    async def collect_metrics(self) -> AggregatedMetrics
    async def generate_report(self)
Key insight: Spawning connections too quickly can skew results. A ramp rate of 100 connections/second prevents thundering herd effects in your tests.
Concurrency Test Framework
Race conditions in WebSocket handlers are notoriously difficult to reproduce. Your concurrency framework uses controlled timing to expose these issues:
class ConcurrencyScenario:
    def test_simultaneous_messages(self)
    def test_connection_reconnection_race(self)
    def test_broadcast_ordering(self)
    def test_state_synchronization(self)
The trick is using barriers and latches to synchronize multiple clients at precise moments, maximizing collision probability.
Performance Benchmarker
Raw averages hide problems. Your benchmarker captures the full latency distribution:
@dataclass
class PerformanceReport:
    p50_latency: float  # Median
    p95_latency: float  # Most users
    p99_latency: float  # Tail latency
    throughput_mps: float  # Messages per second
    connection_time_ms: float
    memory_usage_mb: float
P99 latency is crucial—if 1% of your users experience 10-second delays, that’s thousands of frustrated users at scale.
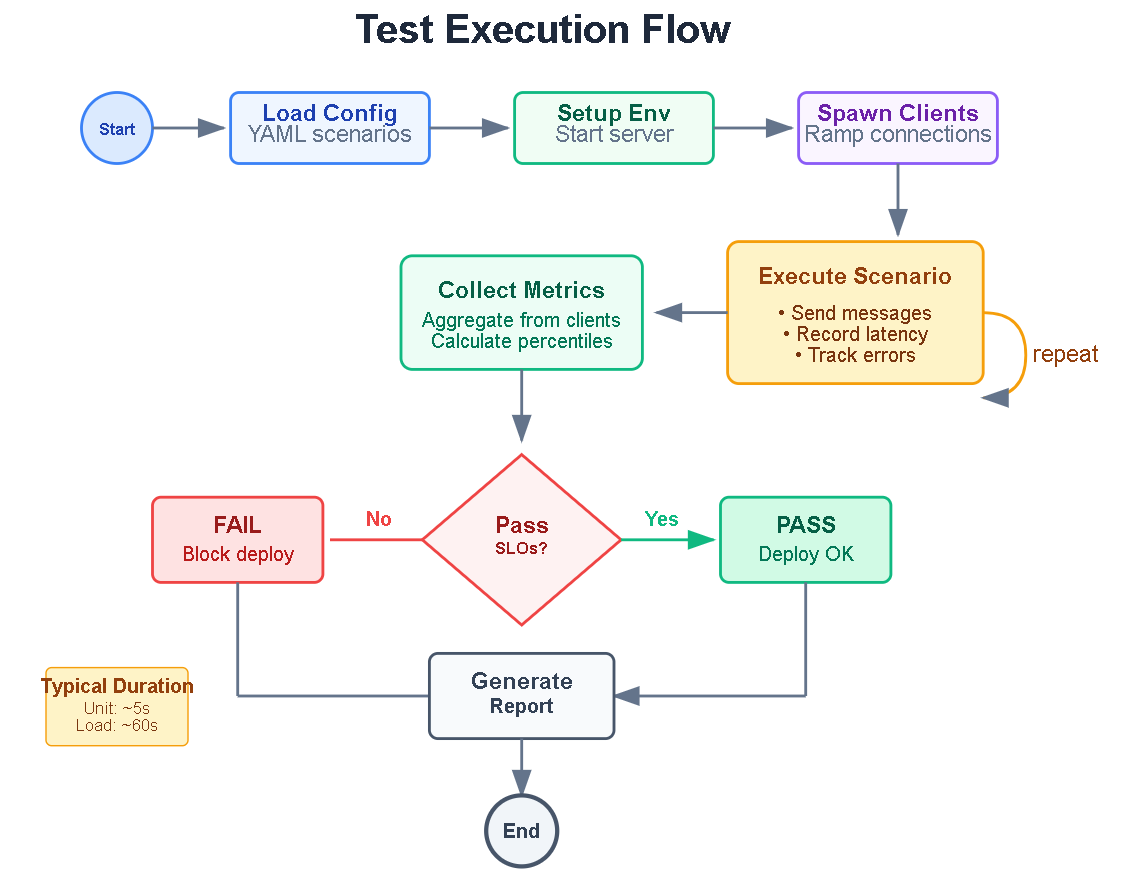
Data Flow Architecture
The test execution follows this flow:
Configuration Loading: Test parameters, scenarios, and thresholds loaded from YAML
Environment Setup: Test server started, monitoring initialized
Client Spawning: Connections established at configured ramp rate
Scenario Execution: Test actions performed with precise timing
Metric Collection: Latency, throughput, errors aggregated in real-time
Analysis and Reporting: Results compared against SLO thresholds, reports generated
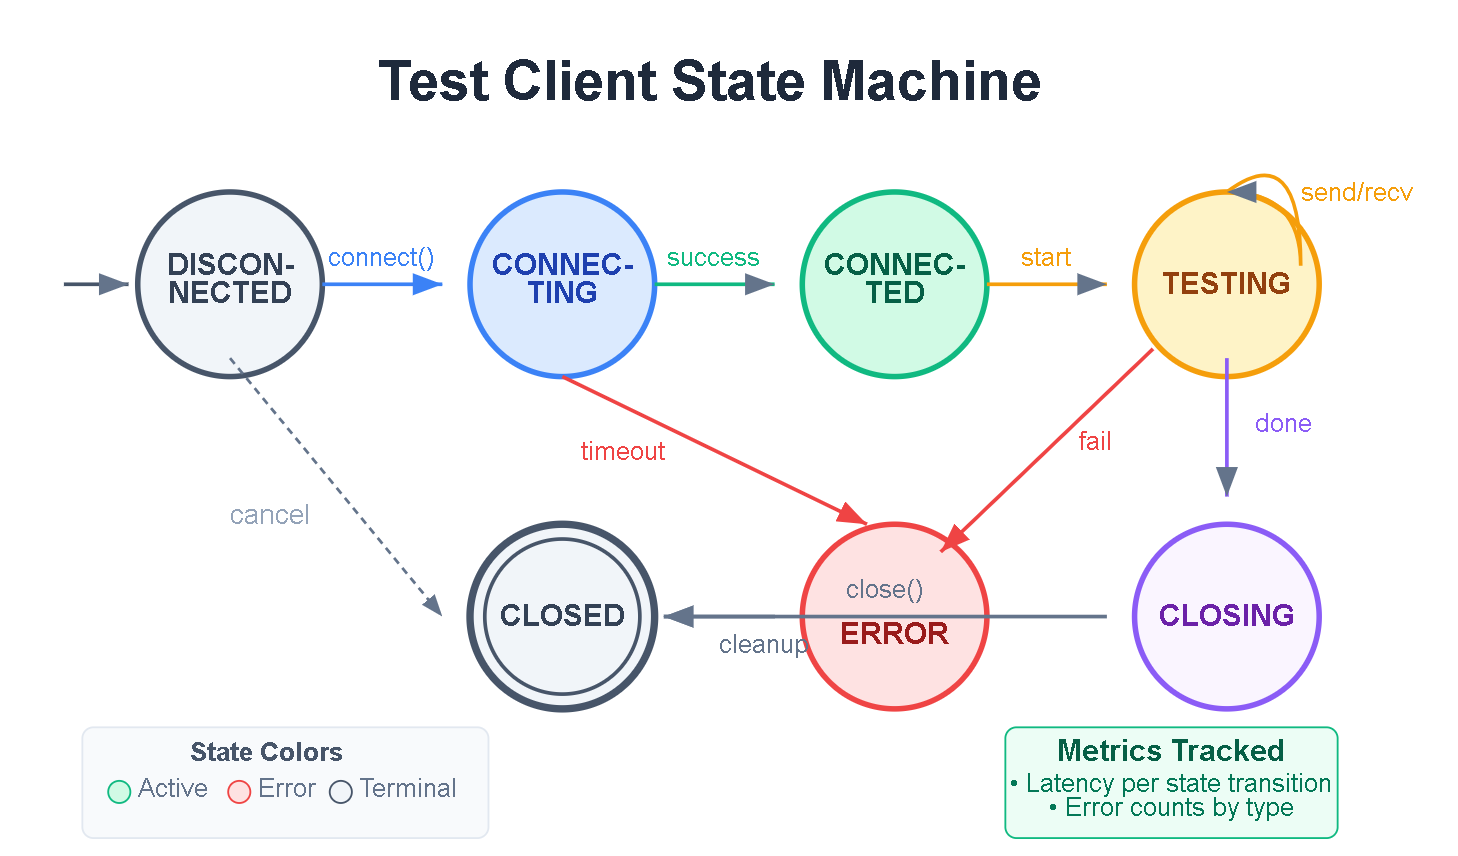
Each test client maintains its own state machine: DISCONNECTED → CONNECTING → CONNECTED → TESTING → CLOSING → CLOSED. The orchestrator tracks aggregate state for the entire test run.
Implementation Patterns
Connection Pooling Tests
Verify your Day 53 connection pool behaves correctly under various conditions:
async def test_pool_exhaustion():
    “”“Test behavior when pool reaches max connections”“”
    pool = ConnectionPool(max_size=100)
    connections = []

    # Exhaust pool
    for _ in range(100):
        conn = await pool.acquire()
        connections.append(conn)

    # 101st should wait or fail gracefully
    with pytest.raises(PoolExhaustedError):
        await asyncio.wait_for(pool.acquire(), timeout=1.0)
Message Queue Stress Tests
Push your message queue to its limits:
async def test_queue_backpressure():
    “”“Verify queue handles producer faster than consumer”“”
    queue = MessageQueue(max_size=1000)

    # Producer sends 10,000 messages rapidly
    async def producer():
        for i in range(10000):
            await queue.put(f”msg-{i}”)

    # Consumer processes slowly
    async def consumer():
        processed = 0
        while processed < 10000:
            await queue.get()
            await asyncio.sleep(0.001)
            processed += 1

    # Both should complete without deadlock
    await asyncio.gather(producer(), consumer())
Bandwidth Optimization Verification
Confirm compression and batching actually reduce bandwidth:
def test_message_batching_efficiency():
    “”“Verify batching reduces overhead”“”
    messages = [create_message() for _ in range(100)]

    # Individual sends
    individual_bytes = sum(len(serialize(m)) for m in messages)

    # Batched send
    batched_bytes = len(serialize_batch(messages))

    # Batching should achieve at least 30% reduction
    assert batched_bytes < individual_bytes * 0.7
Load Testing Scenarios
Ramp-Up Test
Gradually increase load to find breaking points:
scenario: ramp_up
config:
  initial_connections: 10
  final_connections: 5000
  ramp_duration: 300  # 5 minutes
  hold_duration: 60   # 1 minute at peak
  message_rate: 10    # per connection per second
Spike Test
Simulate sudden traffic bursts (viral content, breaking news):
scenario: spike
config:
  baseline_connections: 100
  spike_connections: 2000
  spike_duration: 30
  recovery_time: 60
Soak Test
Run extended tests to catch memory leaks and resource exhaustion:
scenario: soak
config:
  connections: 500
  duration: 3600  # 1 hour
  message_rate: 5
  metrics_interval: 60
Chaos Engineering Patterns
Network Partition Simulation
async def test_network_partition_recovery():
    “”“Verify clients reconnect after network restored”“”
    clients = await spawn_clients(100)

    # Simulate partition
    await network.block_port(8000)
    await asyncio.sleep(10)

    # Restore network
    await network.unblock_port(8000)
    await asyncio.sleep(30)

    # Verify reconnection
    reconnected = sum(1 for c in clients if c.connected)
    assert reconnected >= 95  # 95% should recover
Memory Pressure Test
async def test_under_memory_pressure():
    “”“Verify graceful degradation under memory limits”“”
    # Allocate memory to create pressure
    memory_hog = bytearray(500 * 1024 * 1024)  # 500MB

    try:
        metrics = await run_load_test(connections=1000)
        # Should complete, possibly with degraded performance
        assert metrics.error_rate < 0.05  # Max 5% errors
    finally:
        del memory_hog
UI Dashboard Design
Your testing dashboard displays real-time metrics during test execution:
Header: Test name, status (Running/Passed/Failed), elapsed time
Connection Panel:
Active connections gauge
Connection rate graph
Connection errors counter
Performance Panel:
Latency histogram (p50, p95, p99)
Throughput time series
Message success/failure ratio
Resource Panel:
Server CPU/Memory usage
Client resource consumption
Network bandwidth utilization
Results Panel:
Pass/Fail criteria status
Detailed error logs
Export options (JSON, HTML report)
The UI updates every second during tests and provides drill-down capability for investigating anomalies.
Real-World Context
Slack runs 50,000 simulated workspace connections continuously, catching message ordering bugs before they affect real teams.
Zoom performs chaos testing on every release, randomly killing server processes to ensure meetings survive infrastructure failures.
GitHub load tests their presence system (showing who’s online) with 100,000 concurrent connections before each deployment.
Discord maintains a “voice stress test” environment where automated bots join thousands of voice channels simultaneously.
Hands-On Implementation
GitHub Link:
https://github.com/sysdr/infrawatch/tree/main/day54/day54-realtime-testingNow let’s build everything. Follow these steps to create your complete WebSocket testing suite.
Prerequisites
Before starting, ensure you have:
Python 3.11 or higher
Node.js 18 or higher
Docker (optional, for containerized deployment)
Step 1: Create Project Structure
This creates the following structure:
day54-realtime-testing/
├── backend/
│   ├── app/
│   │   ├── main.py
│   │   └── testing/
│   │       ├── ws_client.py
│   │       ├── load_orchestrator.py
│   │       ├── concurrency_tests.py
│   │       ├── chaos_tests.py
│   │       └── benchmarker.py
│   └── requirements.txt
├── tests/
│   ├── unit/
│   ├── integration/
│   ├── load/
│   └── chaos/
├── frontend/
│   └── src/
│       └── App.js
└── reports/
Step 2: Build and Run
Navigate to the project directory and start the build:
cd day54-realtime-testing
./build.sh
Expected Output:
==========================================
Day 54: Real-time Testing - Build & Run
==========================================

[Local Mode]
Creating Python virtual environment...
Installing backend dependencies...
Starting backend server...
Waiting for backend to start...
Backend health check:
{
    “status”: “healthy”,
    “timestamp”: “2025-05-19T10:30:00.000000”
}

Installing frontend dependencies...
Starting frontend...

Services running:
  - Backend: http://localhost:8000
  - Frontend: http://localhost:3000
For Docker deployment:
./build.sh --docker
Step 3: Verify Health
Check that the backend is running:
curl http://localhost:8000/health
Expected Response:
{”status”:”healthy”,”timestamp”:”2025-05-19T10:30:00.000000”}
Check current metrics:
curl http://localhost:8000/api/metrics | python3 -m json.tool
Expected Response:
{
    “connections”: 0,
    “total_messages”: 0,
    “errors”: 0,
    “p50_latency”: 0,
    “p95_latency”: 0,
    “p99_latency”: 0,
    “cpu_percent”: 5.2,
    “memory_mb”: 45.3
}
Step 4: Run Unit Tests
cd backend
pytest ../tests/unit -v
Expected Output:
tests/unit/test_ws_client.py::TestConnectionMetrics::test_empty_latencies PASSED
tests/unit/test_ws_client.py::TestConnectionMetrics::test_latency_calculations PASSED
tests/unit/test_ws_client.py::TestWebSocketTestClient::test_client_initialization PASSED
tests/unit/test_ws_client.py::TestWebSocketTestClient::test_metrics_tracking PASSED

========================= 4 passed in 0.15s =========================
Step 5: Run Integration Tests
pytest ../tests/integration -v
Expected Output:
tests/integration/test_websocket_server.py::TestWebSocketIntegration::test_connection PASSED
tests/integration/test_websocket_server.py::TestWebSocketIntegration::test_ping_pong PASSED
tests/integration/test_websocket_server.py::TestWebSocketIntegration::test_message_send PASSED
tests/integration/test_websocket_server.py::TestWebSocketIntegration::test_echo PASSED
tests/integration/test_websocket_server.py::TestWebSocketIntegration::test_multiple_clients PASSED
tests/integration/test_websocket_server.py::TestWebSocketIntegration::test_reconnection PASSED

========================= 6 passed in 2.34s =========================
Step 6: Run Load Tests
pytest ../tests/load -v --timeout=120
Expected Output:
tests/load/test_load.py::TestLoadScenarios::test_small_load PASSED
tests/load/test_load.py::TestLoadScenarios::test_medium_load PASSED
tests/load/test_load.py::TestLoadScenarios::test_ramp_up PASSED
tests/load/test_load.py::TestBenchmarks::test_benchmark_suite PASSED

========================= 4 passed in 45.67s =========================
Step 7: Run Chaos Tests
pytest ../tests/chaos -v --timeout=120
Expected Output:
tests/chaos/test_chaos.py::TestChaos::test_connection_recovery PASSED
tests/chaos/test_chaos.py::TestChaos::test_message_under_load PASSED
tests/chaos/test_chaos.py::TestChaos::test_slow_consumer PASSED
tests/chaos/test_chaos.py::TestConcurrency::test_simultaneous_connections PASSED
tests/chaos/test_chaos.py::TestConcurrency::test_simultaneous_messages PASSED
tests/chaos/test_chaos.py::TestConcurrency::test_message_ordering PASSED
tests/chaos/test_chaos.py::TestConcurrency::test_broadcast_consistency PASSED

========================= 7 passed in 38.92s =========================
Step 8: Run Complete Test Suite
python run_tests.py
Expected Output:
============================================================
WebSocket Testing Suite - Full Run
============================================================

[1/3] Running Concurrency Tests...
  ✓ PASS - simultaneous_connections
  ✓ PASS - simultaneous_messages
  ✓ PASS - rapid_reconnection
  ✓ PASS - message_ordering
  ✓ PASS - broadcast_consistency

[2/3] Running Chaos Tests...
  ✓ PASS - connection_recovery
  ✓ PASS - message_under_load
  ✓ PASS - slow_consumer
  ✓ PASS - memory_stability

[3/3] Running Performance Benchmarks...
Running benchmark: demo_benchmark (100 connections, 15s)
  P99 Latency: 45.23ms, Throughput: 1523 msg/s, Passed: True
  ✓ PASS - Performance Benchmark
    P99 Latency: 45.23ms
    Throughput: 1523 msg/s

============================================================
Results: 10/10 tests passed
  ✓ All tests passed!

Results saved to reports/test_results.json
Step 9: Verify UI Dashboard
Open your browser and navigate to http://localhost:3000
You should see:
Header with status indicator showing “Idle”
Metric cards displaying Connections, Messages, Throughput, and Errors
Latency Distribution bar chart with P50/P95/P99 values
Throughput Timeline line chart
CPU and Memory gauges showing current resource usage
Test Controls with Quick Test, Load Test, and Stress Test buttons
Test History table (empty initially)
Step 10: Run Test from Dashboard
Click the Quick Test (50 conn) button
Watch the status change to “Running”
Observe metrics updating in real-time:
Connection count climbing
Latency bars appearing
Throughput graph plotting
After approximately 30 seconds, the test completes
Check the Test History table for results showing:
Test name: quick_test
Status: completed
P99 Latency value
Throughput value
Timestamp
Step 11: Explore API Documentation
Navigate to http://localhost:8000/docs to see the interactive Swagger UI.
Key endpoints to explore:
GET /api/metrics- Real-time performance dataGET /api/connections- List of active connectionsPOST /api/tests/start- Start a custom testPOST /api/tests/stop- Stop current testGET /api/tests- View all test results
Step 12: Stop Services
When finished:
./stop.sh
Expected Output:
Stopping services...
Stopping backend (PID: 12345)...
Stopping frontend (PID: 12346)...
All services stopped.
Performance Thresholds Reference
These are the default SLO (Service Level Objective) thresholds your tests validate against:
Metric Threshold What It Means P99 Latency Under 100ms 99% of messages delivered within 100ms Error Rate Under 1% Less than 1 in 100 messages fail Connection Success Over 99% 99% of connection attempts succeed
Troubleshooting Common Issues
Port Already in Use
If you see “Address already in use” errors:
# Find what’s using the port
lsof -i :8000

# Kill it
kill -9 <PID>

# Or use the stop script
./stop.sh
WebSocket Connection Failed
Check that the backend is actually running:
curl http://localhost:8000/health
If no response, check the logs in your terminal where you ran build.sh.
Tests Timing Out
For slower machines, increase the timeout:
pytest --timeout=180 tests/load -v
Memory Issues During Load Tests
Reduce the connection count in test files:
# Change this
await orchestrator.spawn_connections(500)

# To this
await orchestrator.spawn_connections(100)
Success Criteria
After completing this lesson, verify:
[ ] Unit tests pass for all WebSocket handlers
[ ] Integration tests validate message routing and authentication
[ ] Load test successfully runs 1,000+ concurrent connections
[ ] P99 latency stays under 100ms at load
[ ] Concurrency tests detect no race conditions
[ ] System recovers from simulated network partition
[ ] Memory usage stays stable during 10-minute soak test
[ ] Dashboard displays real-time metrics during tests
Working code demo:
Assignment: Build Your Own Stress Scenarios
Objective: Extend the testing framework with custom scenarios relevant to your application.
Required Tasks
Custom Load Profile: Create a load test scenario that models your expected traffic pattern. Include peak hours, gradual ramps, and sudden spikes.
Application-Specific Tests: Write three tests for business logic specific to your WebSocket use case (chat, gaming, monitoring, etc.).
Failure Injection: Implement two chaos tests not covered in this lesson. Ideas:
Slow message consumer (tests backpressure)
Partial network degradation (50% packet loss)
Database connection failure
Redis unavailability
Alert Integration: Add test result notifications to Slack or email. Tests should notify on failure with relevant context.
Performance Regression Detection: Implement comparison between current test results and historical baseline. Alert when performance degrades by more than 10%.
Solution Hints
Custom Load Profile
Use the LoadTestOrchestrator with multiple phases. Model your profile as a list of tuples:
phases = [
    (60, 100, 5),    # 60s ramp to 100 connections, 5 msg/s
    (120, 500, 10),  # 120s at 500 connections, 10 msg/s
    (30, 1000, 20),  # 30s spike to 1000
    (60, 500, 10),   # 60s recovery
]
Business Logic Tests
Inherit from WebSocketTestCase and use fixtures to set up application state. Test message handlers directly before testing through the network.
Chaos Tests
Use the tc (traffic control) utility for network manipulation:
# Add 50% packet loss
tc qdisc add dev lo root netem loss 50%

# Remove when done
tc qdisc del dev lo root
Alert Integration
Create a TestResultNotifier class that formats results and sends via webhook:
class TestResultNotifier:
    def __init__(self, webhook_url):
        self.webhook_url = webhook_url

    async def notify_failure(self, test_name, results):
        payload = {
            “text”: f”Test Failed: {test_name}”,
            “details”: results
        }
        await self.send_webhook(payload)
Regression Detection
Store test results in a JSON file. Load previous results and calculate percentage change:
def check_regression(current, baseline, threshold=0.1):
    for metric in [’p99_latency’, ‘throughput’]:
        change = (current[metric] - baseline[metric]) / baseline[metric]
        if abs(change) > threshold:
            return True, metric, change
    return False, None, None
Key Takeaways
Testing WebSocket systems requires specialized tools that understand persistent connections, bidirectional communication, and timing-sensitive behaviors. Your testing pyramid should include unit, integration, load, and chaos layers.
Performance metrics must capture full distributions—averages hide problems. Focus on p95 and p99 latencies that represent real user experience at scale.
Chaos engineering is essential for real-time systems. Users expect instant reconnection after network issues; your tests should verify this behavior automatically.
Integrate WebSocket tests into CI/CD with clear pass/fail thresholds. Failed tests should block deployment just like failed unit tests.
Quick Reference
Command Description ./build.sh Build and run locally ./build.sh --docker Build and run with Docker ./stop.sh Stop all services pytest tests/unit -v Run unit tests pytest tests/integration -v Run integration tests pytest tests/load -v Run load tests pytest tests/chaos -v Run chaos tests python run_tests.py Run complete test suite curl localhost:8000/api/metrics Get current metrics
Coming Next: Day 55 - Notification System Integration
You’ll combine all Week 7 components—notification routing, real-time delivery, performance optimization, and testing—into a complete production notification system. We’ll integrate with email, SMS, and push notification providers while maintaining the performance characteristics you’ve validated with today’s testing suite.
Day 54 Complete - You’ve built enterprise-grade testing infrastructure for WebSocket systems