Day 41: Alert Management UI
Building Production-Ready Alert Dashboards
What We’re Building Today
Today we’re constructing the visual command center for our alert management system - a comprehensive UI that transforms raw alert data into actionable insights. Think of it as building the “mission control” interface that engineers at Netflix or Spotify use to monitor their systems 24/7.
Key Components:
Interactive alert dashboard with real-time updates
Detailed alert investigation views
Visual rule configuration interface
Historical alert timeline
Bulk operations for managing alert floods
Why Alert UIs Matter in Production
When your system processes millions of requests per second, alerts become your early warning system. But without a proper UI, even the best alerting system becomes noise. Companies like Slack and Discord rely on sophisticated alert dashboards to maintain their 99.99% uptime promises.
The difference between a good and great alert UI lies in cognitive load reduction. Engineers debugging a 3 AM production incident need information hierarchy, not information overload.
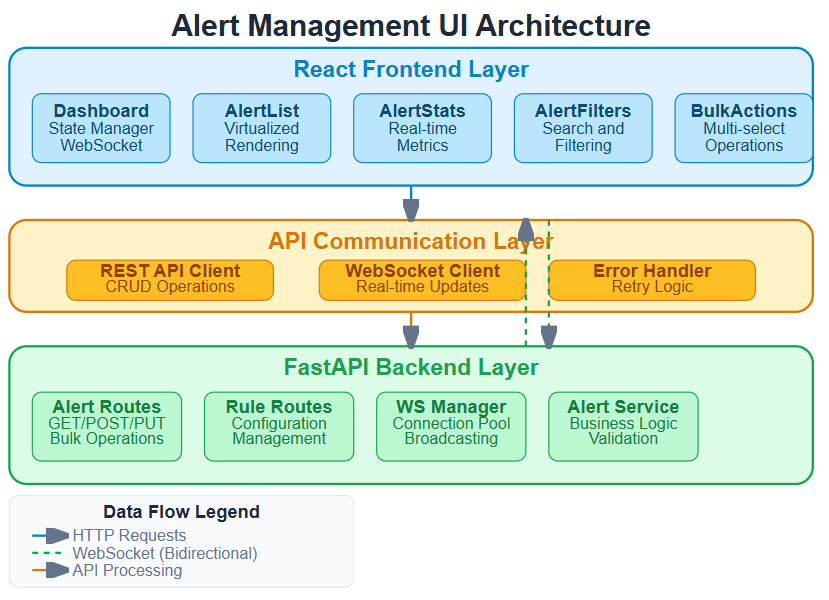
System Architecture Overview
Our Alert Management UI sits as the presentation layer in our infrastructure monitoring stack:
Infrastructure Metrics → Alert Engine → Alert Storage → Alert UI → Engineers