

Day 34: Building Your Task Management UI Dashboard
From the trenches of distributed systems design
What We're Building Today
Today we're constructing the command center of our task processing system - a real-time dashboard that gives you complete visibility and control over your distributed tasks. Think of it as the mission control for your background processes.
Our agenda:
Real-time task monitoring dashboard
Interactive queue visualization
Task control interface (start, stop, retry)
Historical task logs and analytics
Live performance metrics display
Youtube Video:
Why This Matters in Real Systems
Every production system needs observability. Without it, you're flying blind. Companies like Uber track millions of ride requests, GitHub processes countless code deployments, and Netflix manages streaming for millions - all through sophisticated dashboards that reveal system health at a glance.
Your task management UI serves three critical functions: monitoring (what's happening now), control (intervening when needed), and analysis (learning from historical patterns).
Component Architecture Deep Dive
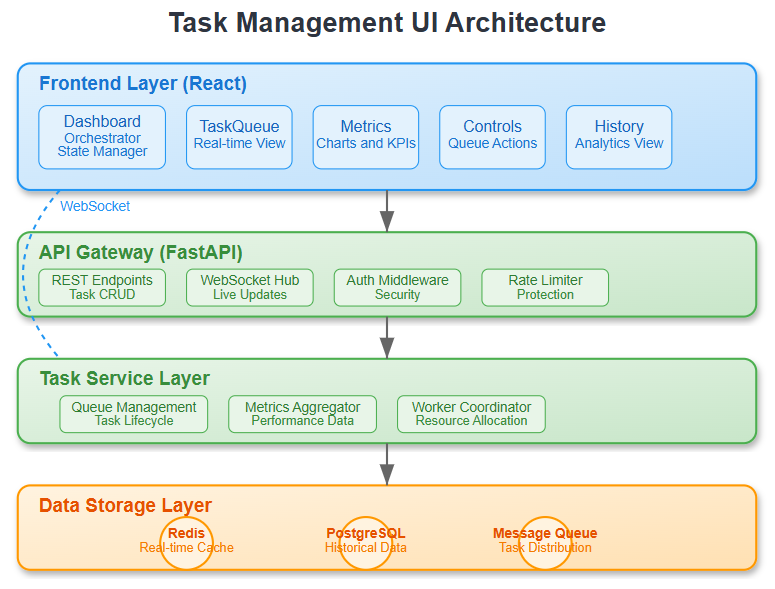
Our dashboard architecture follows a clear separation of concerns:
Frontend Layer: React components that render real-time data and handle user interactions. The dashboard subscribes to WebSocket connections for live updates, ensuring zero-refresh monitoring.
API Gateway: RESTful endpoints that bridge frontend requests with backend services. Handles authentication, rate limiting, and request routing.
Task Service Layer: Core business logic that manages task lifecycle, queue operations, and metric aggregation. This layer abstracts the complexity of distributed task processing.
Data Storage: Redis for real-time metrics and queue state, PostgreSQL for historical task records and audit trails.
Control Flow and Data Movement

The data flows in three primary streams:
Real-time Stream: Task status updates flow through Redis pub/sub to WebSocket connections, updating the UI instantly when tasks start, complete, or fail.
Control Stream: User actions (retry task, pause queue) flow from React components through the API to task service, which updates queue state and triggers worker actions.
Historical Stream: Completed tasks write to PostgreSQL, feeding analytics queries that power trend charts and performance reports.
State Management Strategy
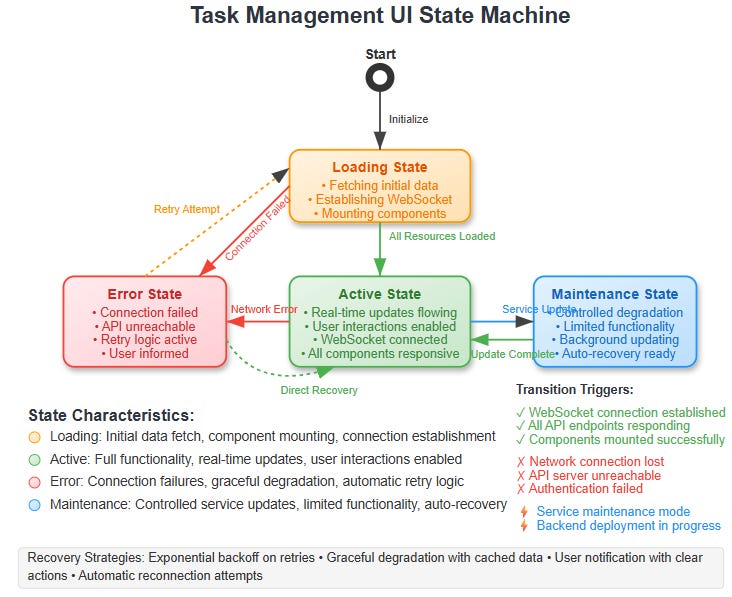
Our dashboard manages four distinct states:
Loading State: Initial data fetch and WebSocket connection establishment
Active State: Real-time updates flowing, user interactions enabled
Error State: Connection failures handled gracefully with retry logic
Maintenance State: Controlled degradation when backend services are updating
Each state transition is explicit and recoverable, ensuring users never lose context or control.
Integration with Infrastructure Management
This UI integrates seamlessly with our broader infrastructure management system. Task metrics feed into alerting systems, performance data influences autoscaling decisions, and historical patterns inform capacity planning.
The dashboard becomes your window into the distributed system's nervous system - revealing not just what tasks are running, but how the entire infrastructure responds to load, failures, and scaling events.
Real-World Production Context
Production task management UIs handle scenarios you'll encounter at scale: dead letter queues filling up, worker nodes becoming unresponsive, and traffic spikes overwhelming processing capacity. Your dashboard needs to surface these issues clearly and provide immediate remediation paths.
The interface you're building mirrors what Site Reliability Engineers use daily at companies processing billions of transactions. Every component serves a purpose learned through operational necessity.
Building the Dashboard: Step-by-Step Implementation
Githun Link:
https://github.com/sysdr/infrawatch/tree/main/day34/day34-task-uiEnvironment Setup
Before we start coding, let's ensure your development environment is ready:
# Verify prerequisites
python3 --version  # Expected: 3.9+
node --version     # Expected: 18+
Create your project workspace and navigate to it. The implementation creates an isolated development environment to prevent dependency conflicts.
Backend Foundation
Our FastAPI backend provides the data and real-time communication layer. The service abstracts complex distributed system operations into clean REST interfaces:
cd day34-task-ui/backend
python3 -m venv venv
source venv/bin/activate
pip install -r requirements.txt
The backend includes:
REST endpoints for task management (
/api/tasks,/api/queues,/api/metrics)WebSocket connections for real-time updates (
/ws)Task control operations (retry, cancel, pause)
Sample data that simulates a real task processing system
Frontend Development
The React application uses components styled to match WordPress.org design patterns - clean, professional, and accessible:
cd ../frontend
npm install
Our component hierarchy follows this structure:
Dashboard: Orchestrates layout and manages global state
TaskQueue: Displays task lists with real-time status updates
Metrics: Visualizes performance data with interactive charts
TaskControls: Provides operational control interface for queue management
TaskHistory: Shows historical task analysis with filtering capabilities
Each component handles specific concerns while subscribing to real-time updates through WebSocket connections.
Real-time Connectivity Implementation
WebSocket integration enables live dashboard updates without polling, reducing server load and improving user experience. The connection manager handles:
Automatic reconnection with exponential backoff
Graceful error handling and user notification
Broadcasting updates to all connected clients
State synchronization between frontend components
Building and Running the System
Development Mode (Recommended for Learning)
Start each service in separate terminal windows to see logs and understand the interaction:
Terminal 1 - Start Redis:
redis-server
Terminal 2 - Start Backend:
cd backend
source venv/bin/activate
python app/main.py
Expected output: Server running on http://localhost:8000
Terminal 3 - Start Frontend:
cd frontend
npm start
Expected output: React dev server on http://localhost:3000
Production Mode (Docker)
For a complete containerized setup:
cd docker
docker-compose up --build
This orchestrates all services with proper networking and service discovery.
Testing Your Implementation
Backend API Validation
Test each endpoint to ensure proper data flow:
# Test task retrieval
curl http://localhost:8000/api/tasks

# Test queue statistics
curl http://localhost:8000/api/queues

# Test performance metrics
curl http://localhost:8000/api/metrics
Frontend Functionality Tests
Open http://localhost:3000 and verify:
Dashboard Loading: All components render without errors, header shows system statistics
Real-time Updates: WebSocket connection establishes (check browser dev tools), metrics update automatically
Task Controls: Retry/cancel buttons trigger API calls, queue operations execute properly
Navigation: Tab switching works smoothly between Overview, Queue, History, and Metrics
Responsive Design: Interface adapts properly to different screen sizes
Integration Testing
Run the automated test suites:
# Backend unit tests
cd backend
python -m pytest tests/

# Frontend component tests
cd frontend
npm test
UI Dashboard Verification
Your completed dashboard should demonstrate:
Core Functionality:
Header displays current system statistics (running tasks, pending tasks, throughput)
Navigation tabs function properly with smooth transitions
Task queue shows real-time status updates with progress bars
Metrics charts render performance data with proper scaling
Control buttons execute queue operations (start, pause, restart, clear)
History view filters and searches tasks effectively
WebSocket connection remains stable during extended use
Error states handled gracefully with user-friendly messages
Professional Styling:
Clean color scheme following WordPress.org design patterns
Consistent spacing and typography throughout
Accessible form controls with proper contrast ratios
Responsive grid layouts that work on desktop and mobile
Subtle shadows and borders for visual hierarchy
Clear status indicators and interactive feedback
Performance and Production Readiness
Error Handling Patterns
Components gracefully degrade when backend services are unavailable. Connection failures trigger automatic retry logic with exponential backoff, ensuring users always have context about system state.
Optimization Techniques
The implementation includes several performance optimizations:
Virtual scrolling for large task lists
Chart data sampling for smooth rendering
Component update debouncing to prevent excessive re-renders
Efficient state management to minimize unnecessary updates
Security Considerations
API endpoints validate input parameters, WebSocket connections authenticate before accepting messages, and sensitive operations require confirmation dialogs to prevent accidental actions.
Troubleshooting Common Issues
WebSocket Connection Failures: Verify backend is running before starting frontend. Check that no firewall settings block WebSocket connections on port 8000.
Chart Rendering Problems: Ensure Recharts dependencies are properly installed. Container dimensions must be defined for responsive charts to render correctly.
State Management Complexity: The implementation uses React's built-in state management effectively. For more complex scenarios, consider Redux patterns in future iterations.
Success Criteria
By lesson's end, you'll have:
A responsive dashboard displaying live task metrics with professional styling
Interactive controls for queue management that execute real operations
Historical charts showing task processing trends over time
Error tracking and alerting integration with graceful failure handling
Performance metrics that reveal system bottlenecks and optimization opportunities
Working Code Demo:
Tomorrow's Connection
Day 35 integrates everything into end-to-end workflows. Your dashboard becomes the control center for complex processing pipelines, where multiple task types coordinate to deliver complete business functionality.
The monitoring foundation you build today enables the advanced orchestration patterns we'll explore next - because you can't manage what you can't measure. Your UI components will extend to handle workflow visualization, dependency tracking, and cascade failure analysis, all building on the solid monitoring base established today.