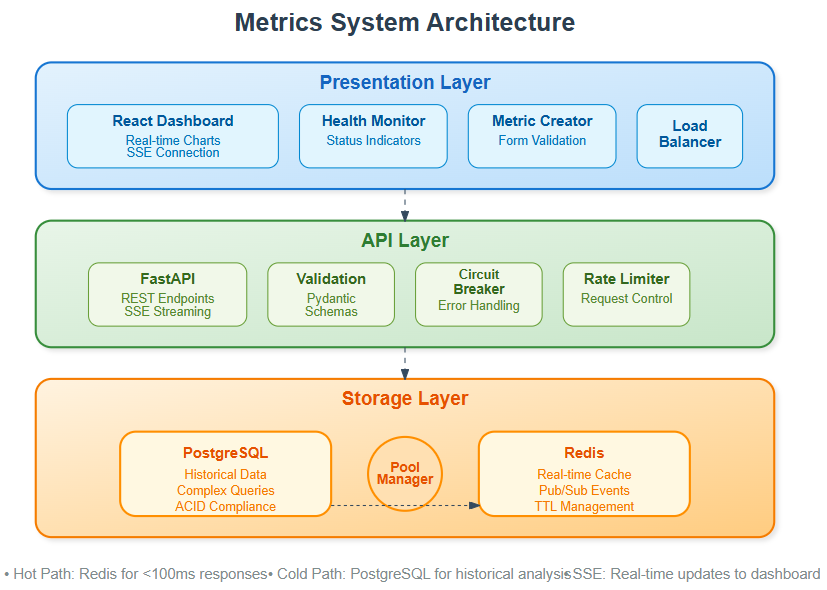
Day 28: Metrics System Integration
Week 4 of 180-Day Full Stack Development with Infrastructure Management
Preview:
What We're Building Today
Today we're connecting all the dots in our metrics pipeline. We'll wire up our dashboard from Day 27 to real storage, create live data streams, and stress-test everything under load. Think of it like plumbing - we're connecting the pipes and making sure water flows smoothly from source to sink.
Today's Learning Goals:
Storage integration with PostgreSQL and Redis
Real-time data streaming via Server-Sent Events
Bulletproof error handling and circuit breakers
Load testing with realistic traffic patterns
End-to-end monitoring dashboard
Prerequisites Check
Before we begin, make sure you have:
Python 3.11+ installed
Node.js 18+ installed
Docker and Docker Compose
Basic understanding of async/await patterns
Your Day 27 dashboard project (we'll build on these concepts)
The Big Picture: Why Integration Matters
Yesterday you built a beautiful dashboard that displayed mock data. Today, that dashboard becomes a mission-critical monitoring tool that could save your company millions during an outage.
Netflix processes over 8 billion events per day through their metrics pipeline. When their recommendation engine slows down by 100ms, they lose $1 billion annually. Your integration layer is what catches these issues before customers notice.