

What We’re Building Today
A QA Integration Service (Python/FastAPI) that orchestrates test execution across unit, integration, and end-to-end layers
Quality Gate Engine — automated pass/fail decisions based on coverage thresholds, error budgets, and performance baselines
Test Reporting Dashboard (React) with real-time pipeline status, metrics charts, and drill-down failure analysis
Procedure documentation generator — auto-exports quality runbooks from live pipeline data
Where This Fits
You’ve spent the last two weeks writing tests — unit, integration, UAT. Today is the day those tests graduate from “files on disk” to a living quality system. Think of it like going from having individual smoke detectors to installing a full building fire-safety network: alarm panels, suppression systems, evacuation logs.
In production, companies like Spotify, Stripe, and Atlassian don’t just run tests — they route test results through quality gates that decide whether a build proceeds. That gate is what you’re building today.
Core Concept: Quality Gates Are Decision Engines
A quality gate is not a test. It’s a policy enforcer. It consumes test results and makes a binary decision: does this build meet the bar we set?
The bar has three dimensions in real systems:
Dimension Example Threshold Why It Matters Coverage ≥ 80% line coverage Prevents untested code reaching prod Failure Rate 0 failing tests One broken test = one production risk Performance p95 < 500ms Regressions caught before merge
When Netflix deploys 1000x/day, each deploy goes through a gate. If anything drops below threshold, the gate blocks the deploy — automatically, no human needed.
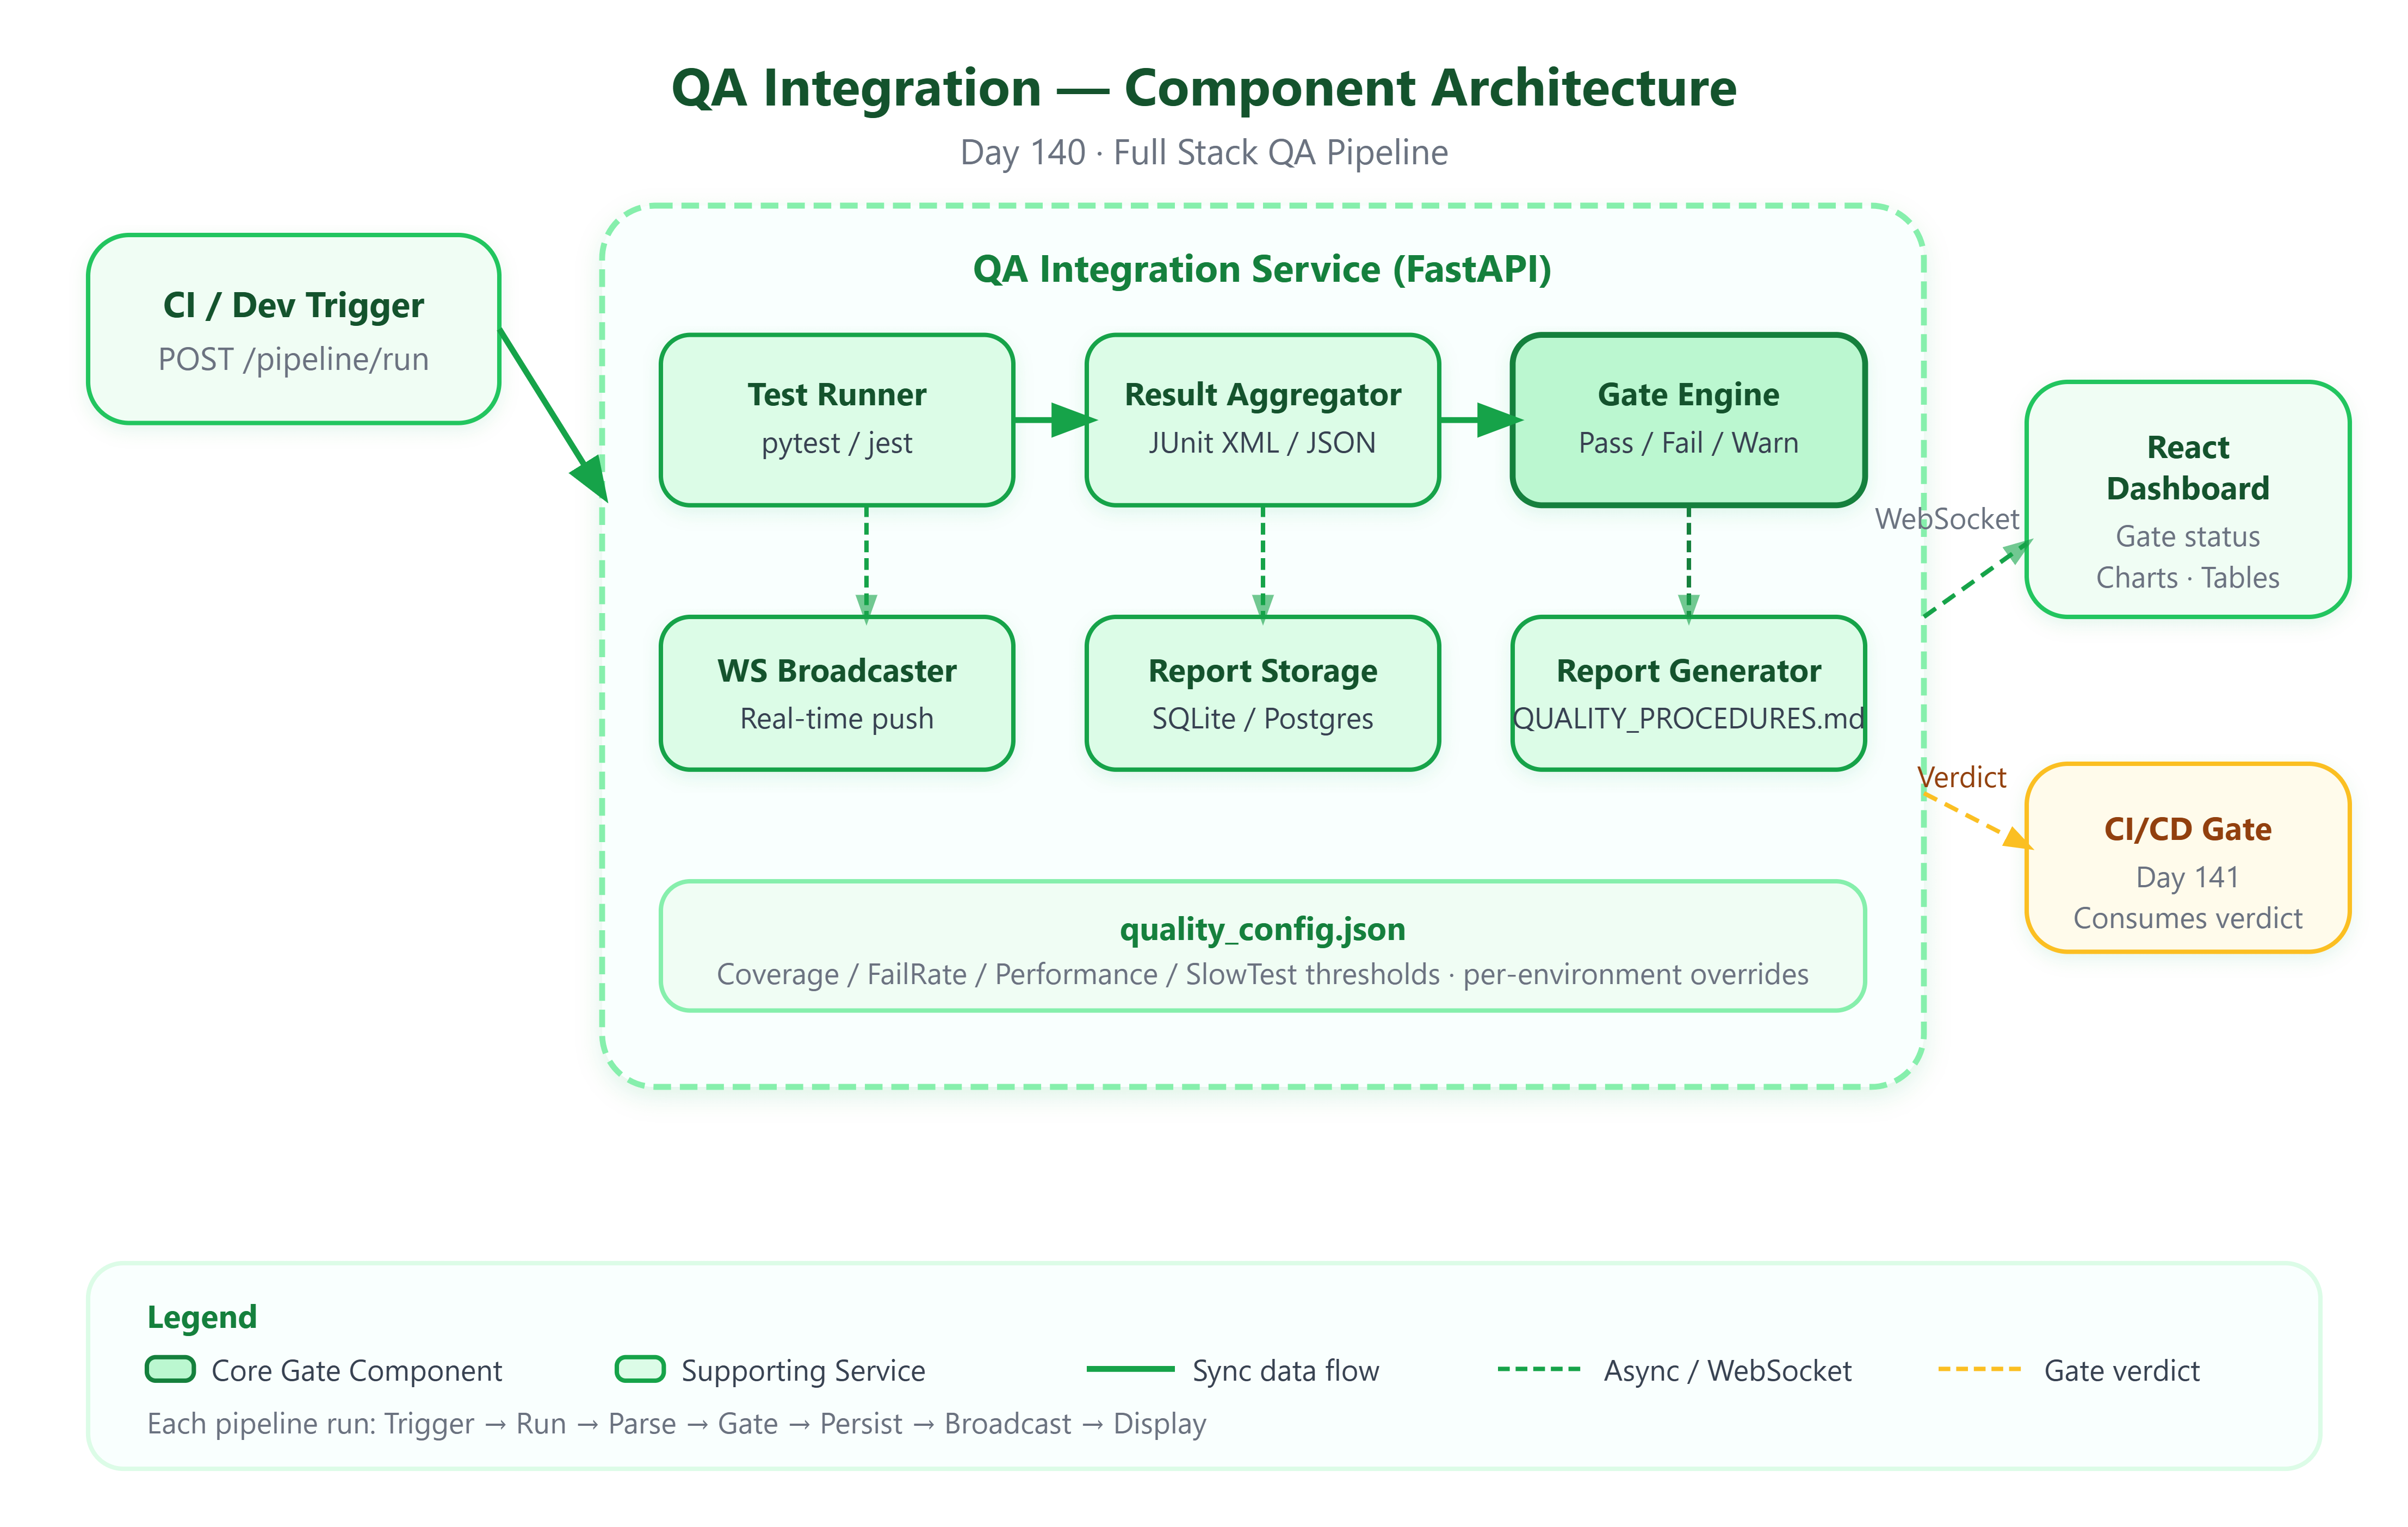
Architecture: How the Pipeline Flows
Component Breakdown
┌─────────────────────────────────────────────────────┐
│                  QA Integration Service              │
│                                                     │
│  [Test Runner] → [Result Aggregator] → [Gate Engine]│
│       ↓                ↓                    ↓       │
│  pytest/jest      JSON Reports        Pass/Fail     │
│                        ↓                    ↓       │
│               [Report Storage]      [Webhook Notify]│
│                        ↓                            │
│               [React Dashboard]                     │
└─────────────────────────────────────────────────────┘
Test Runner — executes pytest (backend) and jest (frontend) in isolated subprocesses. Captures stdout, exit codes, and coverage XML.
Result Aggregator — parses JUnit XML + coverage.xml into a unified schema. Every test run becomes a structured event with timestamp, suite name, pass/fail counts, and per-file coverage.
Gate Engine — compares aggregated results against configurable thresholds stored in quality_config.json. Produces a gate verdict with a detailed breakdown.
Report Storage — SQLite (dev) / PostgreSQL (prod) stores every pipeline run. Enables trend analysis: “has coverage been dropping over the last 10 commits?”
React Dashboard — polls the QA service every 5 seconds. Shows pipeline status, quality gate verdict, coverage trends, and test failure details.
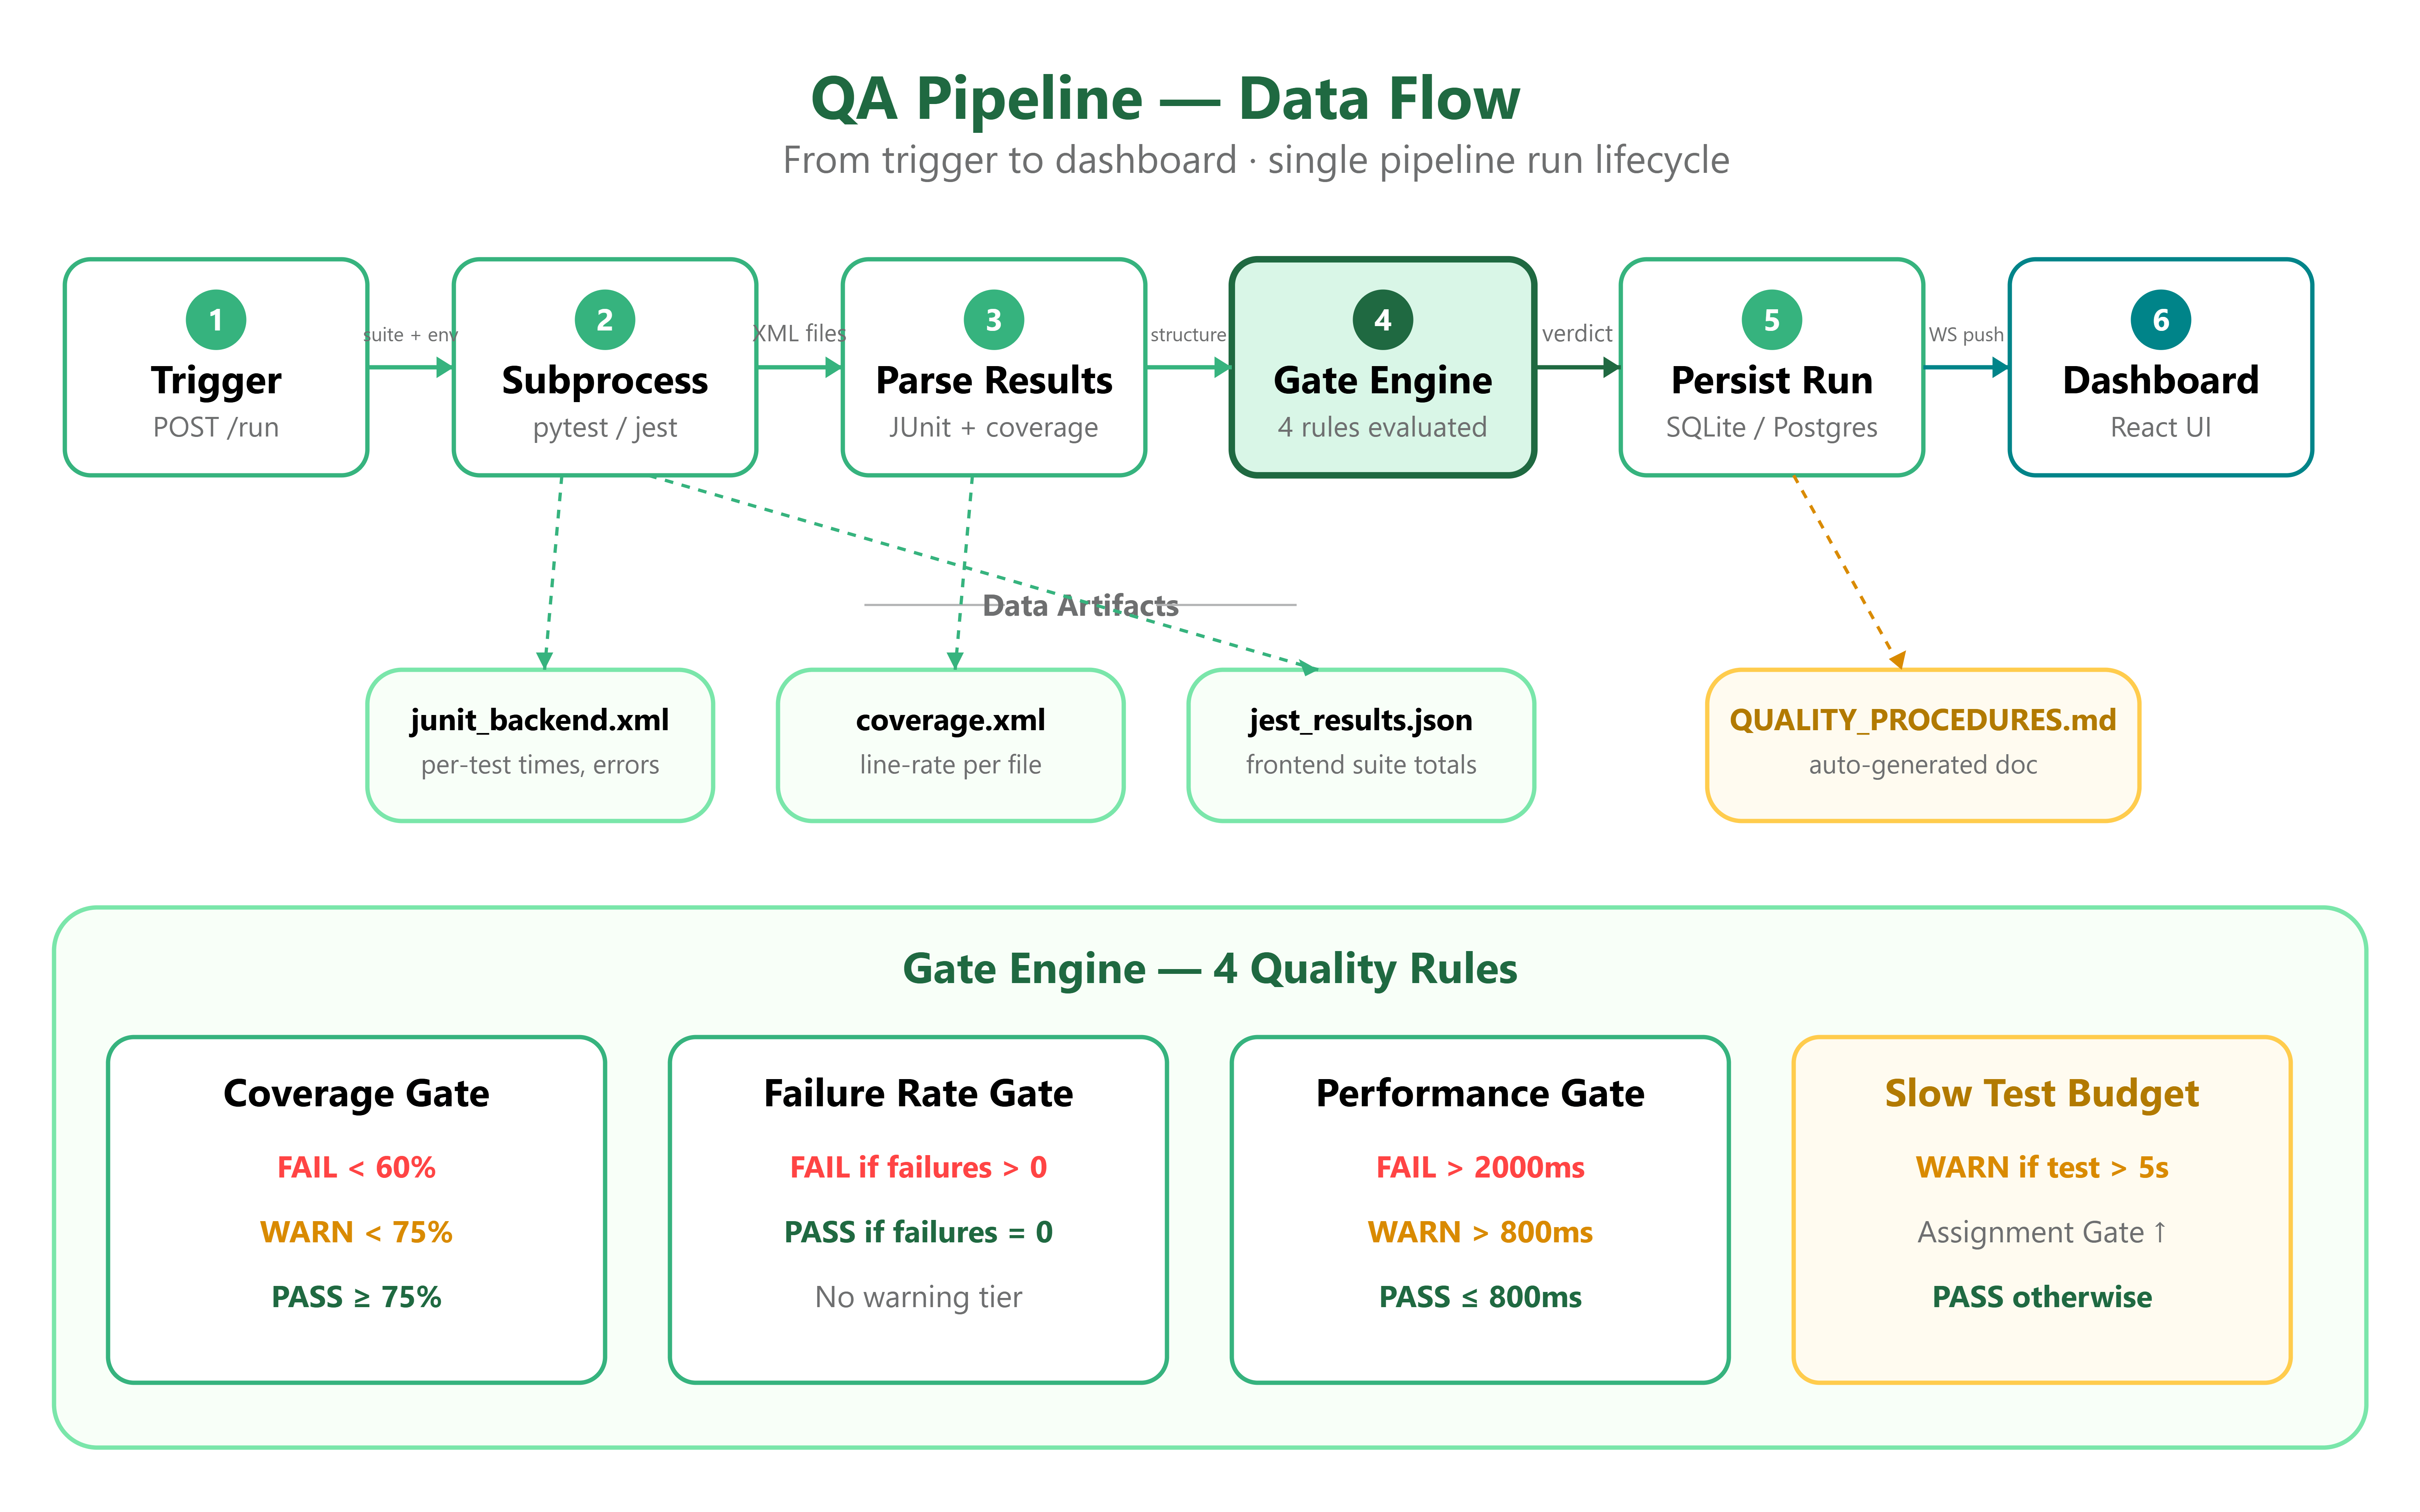
Control Flow: A Pipeline Run Step-by-Step
Trigger — POST
/api/pipeline/runwith suite name (e.g.,"backend","frontend","e2e")Dispatch — Gate Engine spawns subprocess, runs appropriate test command
Parse — On completion, JUnit XML parsed into structured run object
Evaluate — Each gate rule checked: coverage ≥ threshold? failures == 0? duration < max?
Persist — Run stored with verdict (PASS/FAIL/WARNING) and all metrics
Broadcast — WebSocket pushes status update to connected dashboard clients
Expose — GET
/api/pipeline/runsserves history; GET/api/pipeline/latestfor current verdict
The key architectural insight: the pipeline is stateless per run but stateful across runs. Each execution is atomic; trends emerge from the historical record.
Quality Gate Configuration
This is where most teams get it wrong — they hardcode thresholds. Production systems make thresholds configurable per environment:
{
  “gates”: {
    “coverage”: { “warning”: 75, “failure”: 60 },
    “test_failure_rate”: { “failure”: 0 },
    “performance_p95_ms”: { “warning”: 800, “failure”: 2000 }
  },
  “environments”: {
    “staging”: { “coverage”: { “failure”: 50 } },
    “production”: { “coverage”: { “failure”: 80 } }
  }
}
Staging has looser gates because it’s an experimentation zone. Production gates are strict because failures there are customer-facing.
Test Automation Validation
“Validate test automation” doesn’t mean re-running tests. It means verifying the test infrastructure itself is healthy:
Are test suites discoverable? (
pytest --collect-onlyexit code 0)Do test fixtures set up and tear down cleanly? (no leftover temp files, no leaked DB state)
Is coverage instrumentation active? (coverage.xml exists after run)
Are tests deterministic? (flaky test detector — run same suite 3x, flag any test that doesn’t produce consistent results)
This is called test hygiene validation — a practice large eng orgs run as a separate CI step before the actual test run.
Reporting System Architecture
Real reporting isn’t a pretty PDF — it’s a queryable data store with a visualization layer on top.
Data Schema per Run:
pipeline_run {
  id, triggered_at, suite, status,
  total_tests, passed, failed, skipped,
  coverage_pct, duration_ms, gate_verdict,
  failures: [{test_name, file, line, error_msg}]
}
The React dashboard visualizes:
Trend line — coverage % over last 20 runs (recharts LineChart)
Status board — current gate verdict with color coding (green/yellow/red)
Failure table — expandable rows with error details and file:line references
Suite breakdown — unit vs integration vs e2e pass rates
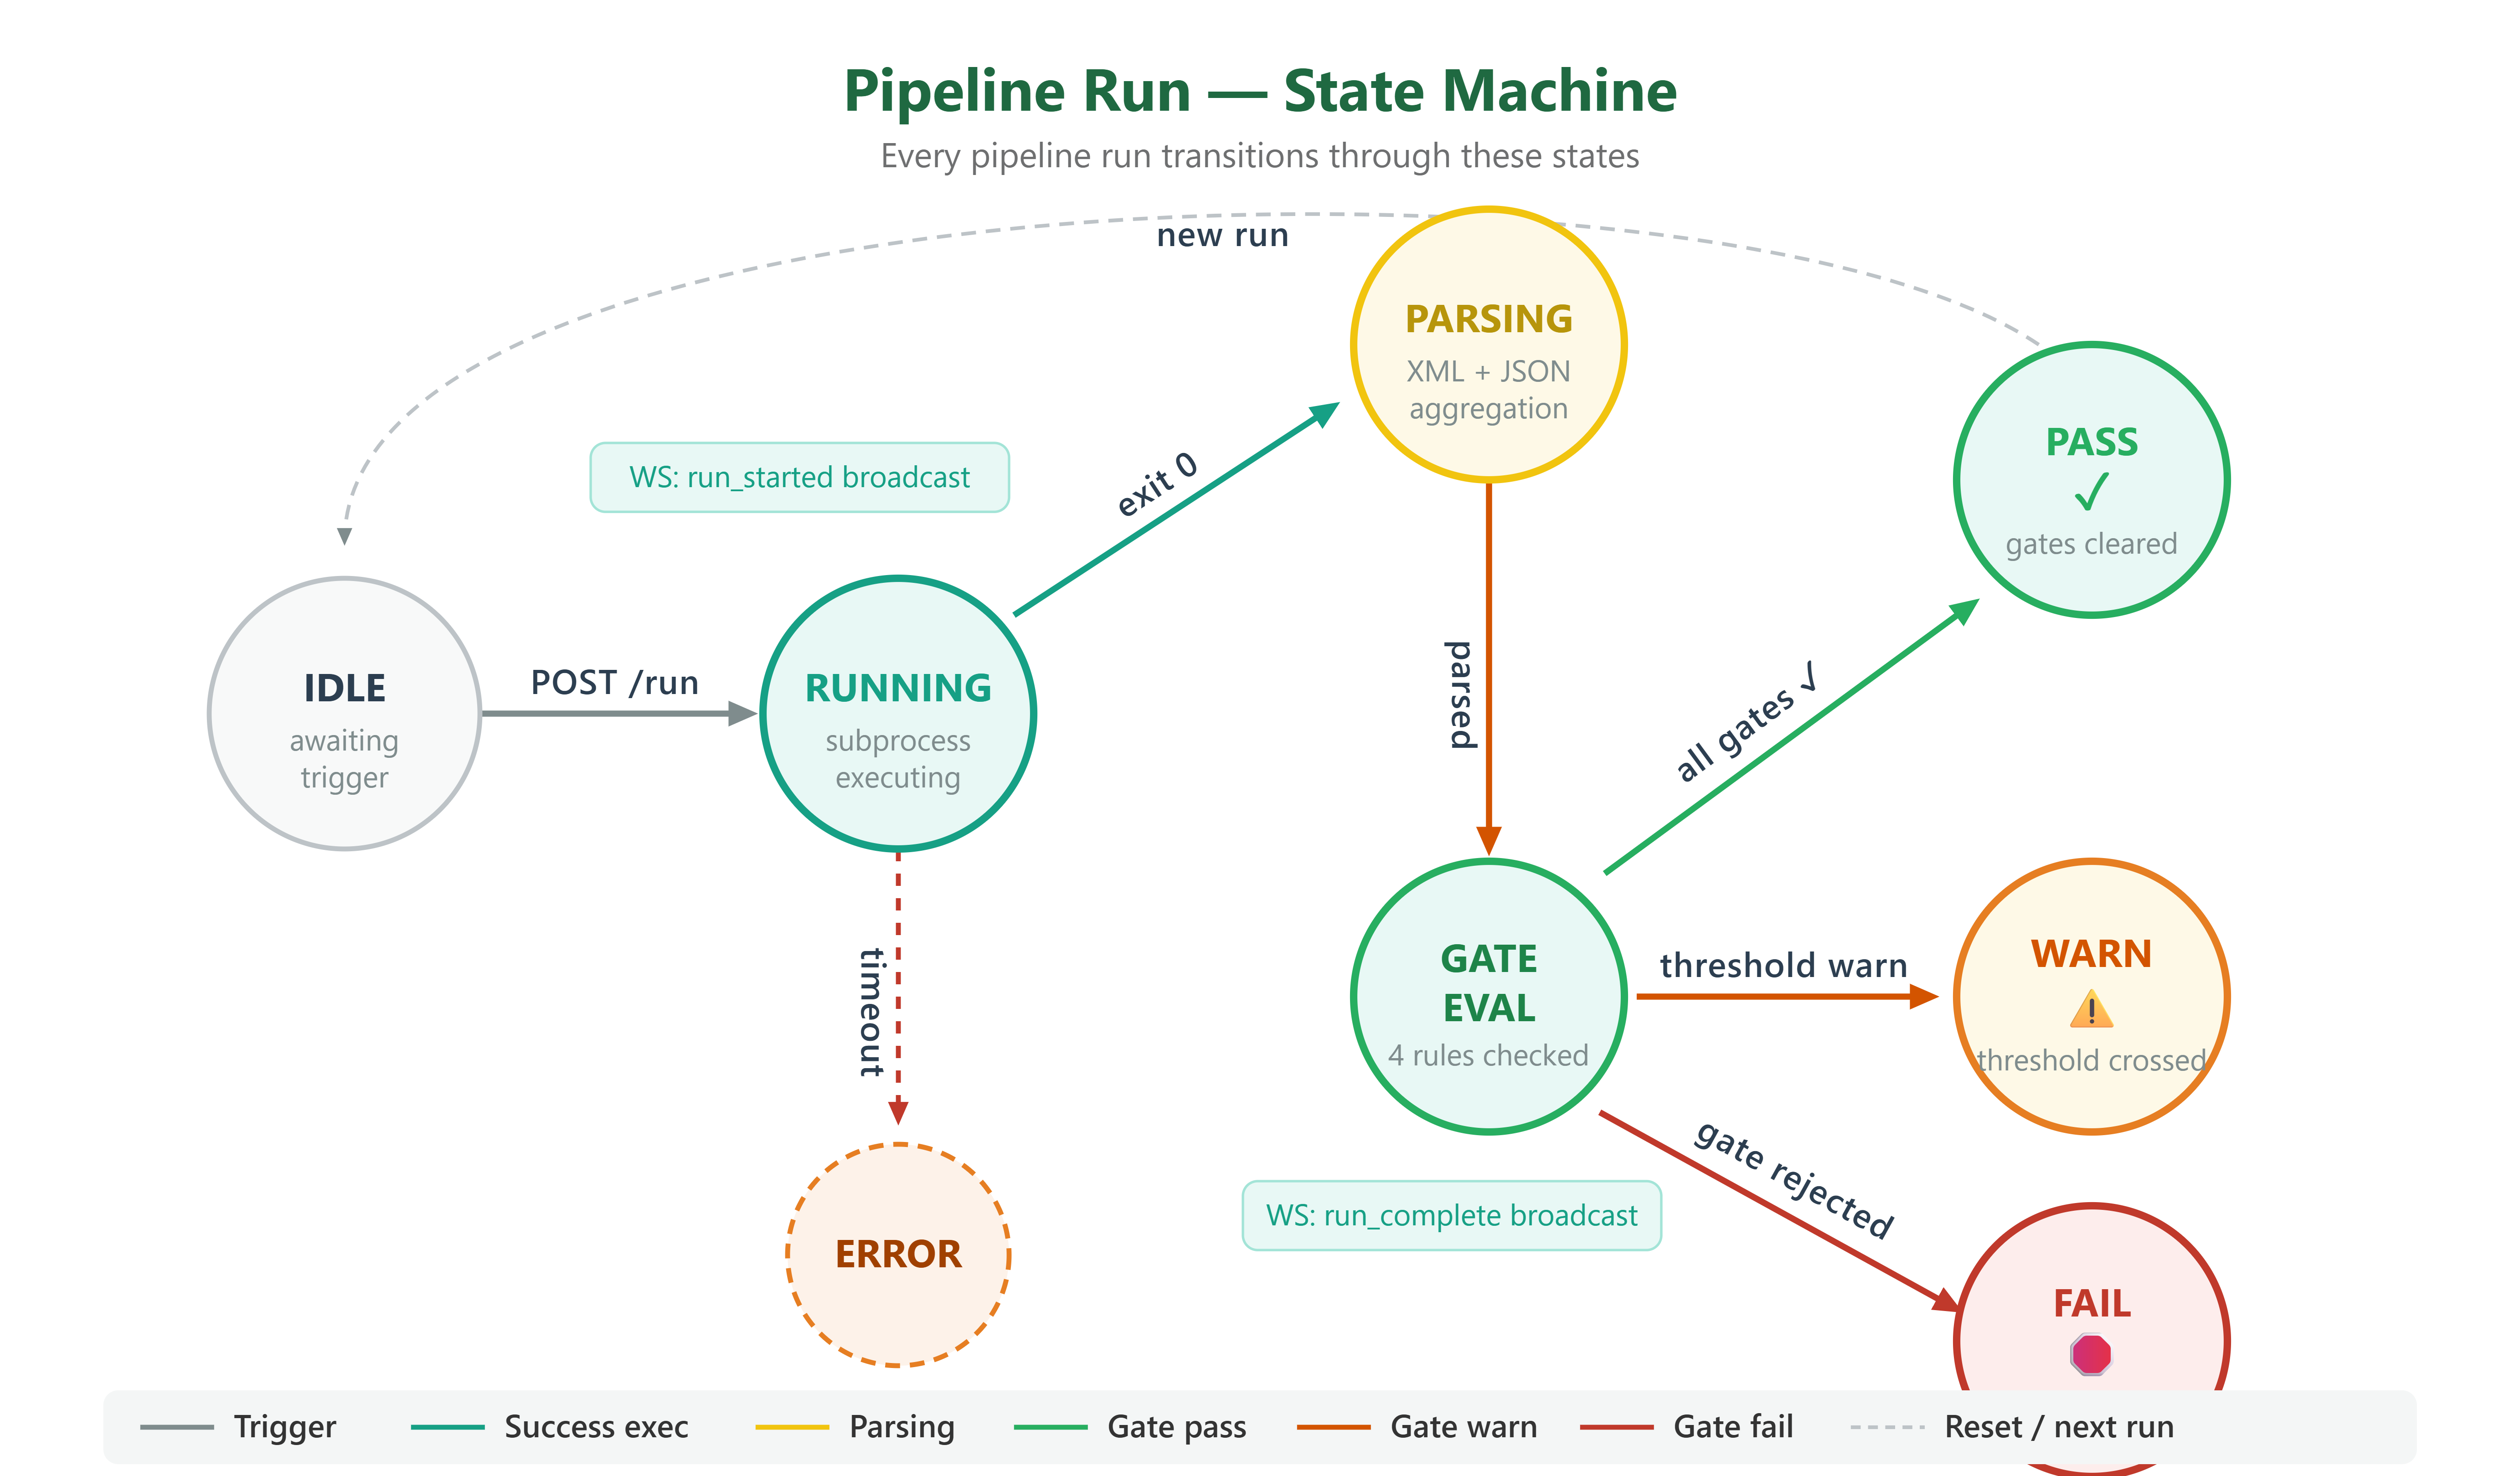
Quality Procedures Documentation
The automation generates a living QUALITY_PROCEDURES.md from actual pipeline data — not hand-written docs that go stale. It captures:
Current gate thresholds (from
quality_config.json)Last 5 pipeline verdicts with timestamps
Failure patterns (which files fail most often)
Coverage hotspots (files below threshold)
This is how mature teams ensure documentation stays current: generate it from the source of truth, not from memory.
Implementation, Build, Test & Demo Guide
Github Link:
https://github.com/sysdr/infrawatch-fullstack-p/tree/main/day140/qa_integration
Prerequisites
Python 3.11+
Node.js 20+
Docker + Docker Compose (optional)
curlandjqinstalled
Architecture Summary
qa_integration/
├── backend/
│   ├── main.py                          # FastAPI entry point
│   ├── requirements.txt
│   ├── pytest.ini
│   ├── app/
│   │   ├── api/pipeline.py              # REST + WebSocket endpoints
│   │   ├── core/{config,database}.py    # Settings + SQLAlchemy async
│   │   ├── models/pipeline.py           # PipelineRun ORM model
│   │   └── services/
│   │       ├── test_runner.py           # Subprocess test executor
│   │       ├── result_parser.py         # JUnit XML + coverage parser
│   │       ├── gate_engine.py           # Quality gate evaluator
│   │       └── report_generator.py      # Markdown report generator
│   ├── sample_tests/                    # Real tests for gate demo
│   └── tests/unit/ + integration/
├── frontend/
│   └── src/
│       ├── App.js                       # Dashboard shell
│       ├── api/pipeline.js              # Axios API client
│       ├── hooks/usePipeline.js         # Data fetching + WebSocket
│       └── components/                  # GateVerdict, Charts, Tables
├── reports/                             # junit XML, coverage.xml, report.md
├── quality_config.json                  # Gate thresholds
├── start.sh
└── stop.sh
Part A: Without Docker
Step 1 — Build and Start Everything
chmod +x start.sh stop.sh
./start.sh
Expected output (last lines):
[OK] Backend running at http://localhost:8001
[OK] Pipeline run complete → Verdict: PASS | Coverage: 85.2% | Tests: 10
[OK] Hygiene check → healthy: True
Day 140 QA Integration — Build Complete!
  Backend API:  http://localhost:8001
  Frontend:     http://localhost:3001
Step 2 — Verify Backend Health
curl http://localhost:8001/api/pipeline/health
Expected:
{”status”: “ok”, “service”: “qa-integration”}
Step 3 — Trigger a Backend Pipeline Run
curl -s -X POST http://localhost:8001/api/pipeline/run \
  -H “Content-Type: application/json” \
  -d ‘{”suite”:”backend”,”environment”:”development”}’ | python3 -m json.tool
Expected (excerpt):
{
  “id”: 1,
  “suite”: “backend”,
  “status”: “PASS”,
  “gate_verdict”: “PASS”,
  “total_tests”: 10,
  “passed”: 10,
  “failed”: 0,
  “coverage_pct”: 85.2,
  “gate_details”: {
    “coverage”: {”actual”: 85.2, “status”: “PASS”},
    “test_failure_rate”: {”actual”: 0, “status”: “PASS”},
    ...
  }
}
Step 4 — Trigger a Frontend Pipeline Run
curl -s -X POST http://localhost:8001/api/pipeline/run \
  -H “Content-Type: application/json” \
  -d ‘{”suite”:”frontend”,”environment”:”staging”}’
Step 5 — View Run History
curl -s http://localhost:8001/api/pipeline/runs | python3 -m json.tool | head -60
Step 6 — Run Hygiene Validation
curl -s -X POST http://localhost:8001/api/pipeline/validate-hygiene | python3 -m json.tool
Expected:
{
  “healthy”: true,
  “checks”: [
    {”name”: “Test Discovery”, “status”: “PASS”, “detail”: “All tests discoverable”},
    {”name”: “Reports Directory”, “status”: “PASS”, “detail”: “Writable”},
    {”name”: “Quality Config”, “status”: “PASS”, “detail”: “4 gates configured”}
  ],
  “issues”: []
}
Step 7 — Generate Quality Procedures Report
curl -s http://localhost:8001/api/pipeline/report | python3 -c “import sys,json; print(json.load(sys.stdin)[’report’])”
Expected: a markdown document with gate thresholds, run history table, and failure hotspots.
Step 8 — Open Dashboard
Navigate to
http://localhost:3001
in your browser.
What you should see:
Green header with QA Integration branding
4 stat cards: Total Runs, Pass Rate, Avg Coverage, Last Verdict
Trigger panel — select suite and environment, click ▶ Run Pipeline
After triggering: Gate Evaluation cards (one per gate with PASS/WARNING/FAIL)
Coverage Trend line chart with PROD MIN and WARNING reference lines
Pipeline Run History table — click any row to expand failures
Hygiene tab — run infrastructure health checks
Report tab — generate live quality procedures doc
Step 9 — Run Tests Manually
cd qa_integration
source .venv/bin/activate
cd backend

# Sample tests (gate engine behavior)
python -m pytest sample_tests/ -v

# Unit tests
python -m pytest tests/unit/ -v

# Integration tests
python -m pytest tests/integration/ -v

# Full run with coverage
python -m pytest sample_tests/ tests/ -v \
  --cov=app --cov-report=term-missing
Step 10 — Stop Services
./stop.sh
Part B: With Docker
Step 1 — Build and Start
cd qa_integration/start.sh --docker
Step 2 — Verify
curl http://localhost:8001/api/pipeline/health
curl http://localhost:3001
Step 3 — Trigger Pipeline Run via Docker
curl -X POST http://localhost:8001/api/pipeline/run \
  -H “Content-Type: application/json” \
  -d ‘{”suite”:”backend”,”environment”:”production”}’
Step 4 — Stop Docker Stack
cd qa_integration/ ./stop.sh
Verification Checklist
Check Command Expected Backend health curl :8001/api/pipeline/health {"status":"ok"} Pipeline run POST /api/pipeline/run JSON with gate_verdict Run history GET /api/pipeline/runs Array of runs Hygiene check POST /api/pipeline/validate-hygiene {"healthy":true} Report GET /api/pipeline/report Markdown report Dashboard
http://localhost:3001
Green dashboard renders Coverage trend chart Dashboard → scroll down Line chart visible Failure drill-down Click a run row in history Failure details expand Hygiene tab Dashboard → Hygiene tab Infrastructure checks Report tab Dashboard → Report → Generate Markdown doc rendered
API Reference
Method Path Description GET /api/pipeline/health Service health POST /api/pipeline/run Trigger pipeline run GET /api/pipeline/runs All run history GET /api/pipeline/latest Latest run verdict POST /api/pipeline/validate-hygiene Check test infrastructure GET /api/pipeline/report Generate quality procedures WS /api/pipeline/ws Real-time status updates
Interactive API docs: http://localhost:8001/docs
Assignment Steps
Task: Add a “slow test detection” alert card to the dashboard.
Step 1 — Ensure execution_time_budget_ms is in quality_config.json (it already is, threshold: 5000ms).
Step 2 — In gate_engine.py, verify slow_test_warnings is populated when duration_ms > budget_warning.
Step 3 — In PipelineRun model, slow_test_warnings column stores the list.
Step 4 — In App.js, after GateDetails, add:
{latest?.slow_test_warnings?.length > 0 && (
  <div style={{ background: ‘#fffbeb’, border: ‘1.5px solid #d97706’, borderRadius: 12, padding: 16 }}>
    <b>⚠ Slow Tests Detected</b>
    {latest.slow_test_warnings.map((t, i) => (
      <div key={i}>{t.test_name} — {t.duration_ms.toFixed(0)}ms</div>
    ))}
  </div>
)}
Step 5 — In sample_tests/test_gate_engine.py, add a test that creates a slow test entry and verifies the warning card data is in the gate result.
Hint: To simulate a slow test without actually waiting, add "slow_tests": [{"test_name": "test_db_load", "duration_ms": 7000}] to your make_result() call in a new test case.
Success Criteria
By end of today, you should have:
[ ] QA Integration Service running at
localhost:8001[ ] Quality gates evaluating coverage, failures, and performance
[ ] React dashboard showing real-time pipeline status
[ ] At least one pipeline run stored with full metrics
[ ] Auto-generated
QUALITY_PROCEDURES.mdreflecting live data[ ] Docker Compose bringing up the entire stack in one command
Assignment
Extend the gate engine to support a fourth gate: test execution time budget. If any single test takes longer than 10 seconds, it should trigger a WARNING verdict (not failure, since slowness isn’t broken — but it needs investigation).
Steps:
Add
execution_time_budget_mstoquality_config.jsonIn the Gate Engine, after parsing results, identify any test with
duration_ms > thresholdCollect slow tests into a
slow_test_warningslist on the verdict objectSurface them in the dashboard as a yellow warning card, separate from failures
Hint: JUnit XML has a time attribute on each <testcase> element. Parse it during aggregation and store per-test durations in your run schema.
Key Takeaway
A QA pipeline without gates is a report generator. Gates are what transform quality data into deployment decisions. The moment you wire a gate verdict to a pipeline stage condition (which you’ll do tomorrow), quality enforcement becomes automatic — no human needs to check if coverage dropped. The system decides.
That’s the mental model shift: from “we run tests” to “tests govern deployments.”