

Day 117 — Load Testing
Today’s Agenda
By the end of this lesson you will have a production-grade load testing platform that mirrors what teams at Stripe, GitHub, and Cloudflare use before every major release:
A Locust-powered load testing suite with real HTTP scenarios
A performance benchmarking engine that tracks p50, p95, p99 latencies
Scalability limit detection — the system finds its own breaking point automatically
A stress testing harness that pushes beyond design limits
A live resource monitoring dashboard (CPU, memory, connections, throughput)
A React dashboard styled like k6 Cloud / Artillery Pro with real-time charts
Why Load Testing Isn’t Optional
Netflix runs load tests against every service before a new season drops. They don’t hope their CDN survives — they prove it will.
Your application might handle 10 users flawlessly and collapse at 500. The failure mode isn’t random — it’s deterministic. Load testing finds the exact threshold. Without it, your production incident is your load test, and your users are the testers.
Every load test answers three questions:
Throughput ceiling — how many requests/second before latency degrades?
Latency distribution — what does the slow user experience look like (p99)?
Resource saturation — which component fails first: CPU, DB connections, or memory?
Where This Fits in the Infrastructure Management System
This week (Week 11) we’re inside the User & Team Management domain. Day 116 gave us Redis caching — today’s load tests validate those cache hit rates under real concurrent load. Day 118 (tomorrow) adds APM and dashboards — today’s benchmarks become the baseline metrics those dashboards alert on.
The load testing service sits outside the production stack, firing synthetic traffic at it, while the monitoring layer (Prometheus + psutil) watches from inside. Think of it like a crash-test lab next to the factory.
Part 1 — Core Concepts
1.1 The Latency Percentile Trap
Most engineers watch average latency. Averages lie. If 99 requests complete in 10ms and 1 takes 10 seconds, the average is 109ms — looks fine, feels terrible.
p99 latency is what your slowest 1% of users experience. At Stripe’s scale, 1% means millions of real transactions. Always optimize for p95/p99, not mean.
1.2 Coordinated Omission — The Invisible Bug in Most Load Tests
Standard load tools send a new request only after the previous one completes. Under heavy load, when responses slow down, they send fewer requests — inadvertently hiding the real bottleneck. Locust’s async model avoids this by maintaining a fixed concurrency level regardless of response time.
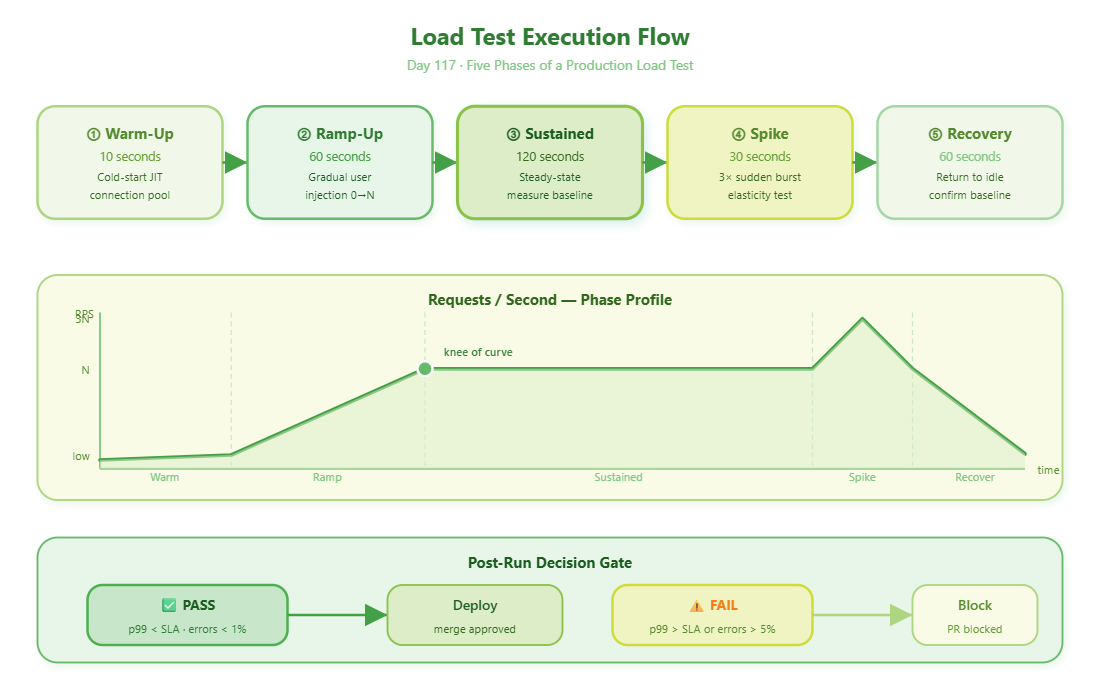
1.3 The Five Load Test Phases
Preparing for a distributed systems interview?
→Download the free Interview Pack
→ Subscribe now to access source code repository - 200 + coding lessons
Warm-up  →  Ramp-up  →  Sustained Load  →  Spike  →  Recovery
  10s          60s           120s            30s         60s
Each phase reveals something different. Warm-up catches cold-start JIT issues. Spike tests elasticity. Recovery confirms your system returns to baseline — a system that degrades and never recovers is a ticking clock.
1.4 Finding the Knee of the Curve
Every system has a throughput knee — the RPS point where adding more load stops increasing throughput but dramatically increases latency. This is your operating ceiling. Beyond the knee, you’re not getting more work done — you’re just making everything slower.
Throughput |    .---------- (knee)
           |   /
           |  /
           | /
           +----------------> Concurrent Users
Part 2 — Component Architecture
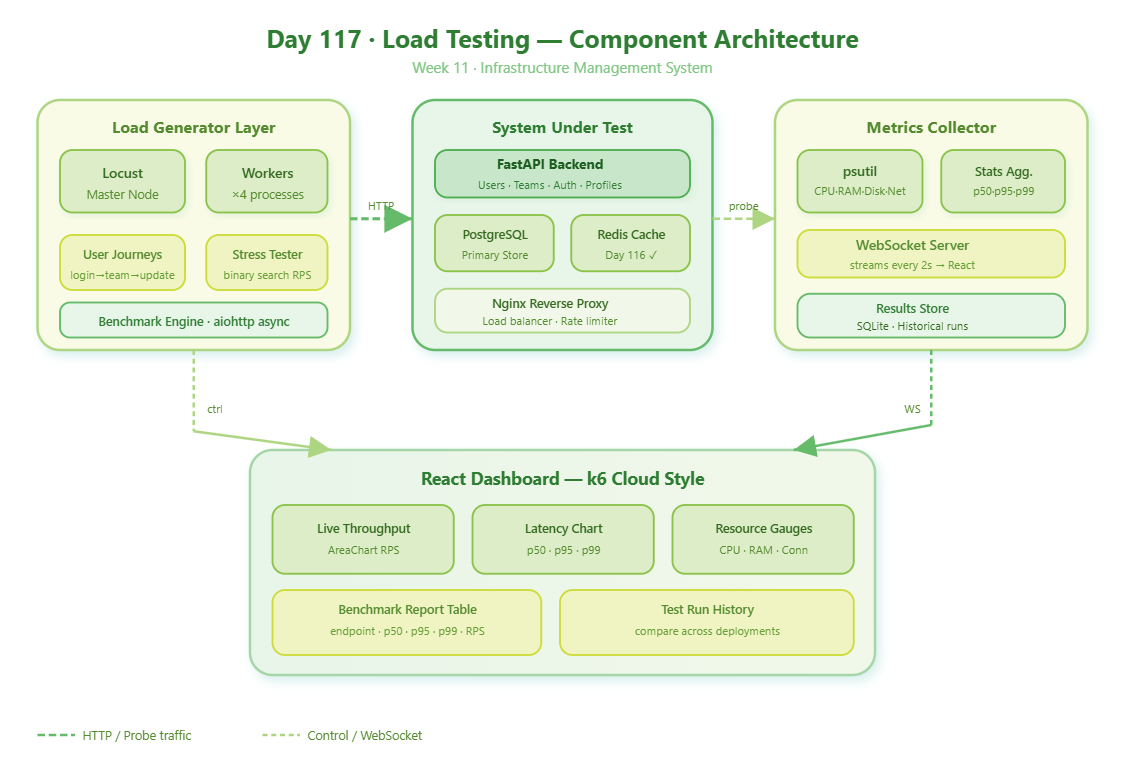
The platform has four layers, each with a distinct responsibility:
Load Generator Layer — Locust workers running distributed across multiple processes, executing realistic user journeys (login → list teams → update profile → logout) rather than single endpoint hammering.
Target Application Layer — Your FastAPI backend + PostgreSQL + Redis from the previous lessons. This is the System Under Test (SUT).
Metrics Collector Layer — psutil for OS-level metrics (CPU, RAM, file descriptors), plus a custom stats aggregator that samples Locust’s internal stats every 2 seconds.
Dashboard Layer — React frontend with Recharts for real-time streaming charts, showing throughput, latency distribution, error rates, and resource utilization side by side.
The relationship between these layers in one line:
[Load Generator] ──HTTP──> [System Under Test] <──probe── [Metrics Collector]
                                                                    |
                                                              WebSocket |
                                                                    v
                                                          [React Dashboard]
The load testing service and the target API live in the same process for this lesson (to simplify setup), but in production these are always separate infrastructure. The metrics collector runs as a background asyncio task.
Part 3 — Implementation Deep Dive
GitHub Link:-
https://github.com/sysdr/infrawatch-fullstack-p/tree/main/day117/load-testing-platform
3.1 Backend: The Load Test Engine (FastAPI)
The backend orchestrates test runs, persists results, and streams live metrics via WebSocket. The key design decision here: test runs are async tasks — the API returns a run_id immediately, and clients poll or subscribe via WebSocket.
# Simplified: start a test run
@app.post("/api/tests/start")
async def start_test(config: TestConfig, background_tasks: BackgroundTasks):
    run_id = str(uuid4())
    background_tasks.add_task(execute_load_test, run_id, config)
    return {"run_id": run_id, "status": "started"}
Why background tasks? Load tests run for minutes. HTTP connections time out. The client disconnects from the trigger endpoint but stays connected to the WebSocket for live data.
3.2 The Database Layer
Load test results don’t need horizontal scaling. SQLite with aiosqlite gives you zero-config persistence that’s adequate for storing thousands of test runs. The async wrapper ensures it doesn’t block the event loop.
# Core pattern: async session factory
engine = create_async_engine("sqlite+aiosqlite:///./data/loadtest.db")
AsyncSessionLocal = async_sessionmaker(engine, expire_on_commit=False)
Four tables power the whole system:
Table What It Stores test_runs Run metadata — config, status, start/end timing test_metrics Time-series snapshots — RPS, latency, CPU every 2s benchmark_results Per-endpoint p50/p95/p99 measurements stress_results Max RPS ceiling findings from binary search
3.3 The Target API (System Under Test)
The target API simulates a realistic User & Team Management service with intentional variable latency. This variance is critical — it ensures percentile measurements are meaningful rather than perfectly uniform.
# Pseudo-code: realistic endpoint with variable latency
async def list_users(page, limit):
    await asyncio.sleep(random.uniform(0.02, 0.08))  # 20-80ms variance
    return paginated_users(page, limit)
When you hit /api/health directly you’ll see:
{"status": "ok", "timestamp": 1748700000.123}
3.4 Locust Test Scenarios — The User Journeys
Rather than hitting /health a million times, realistic load tests mimic actual user behavior with probabilistic branching:
class UserTeamJourney(HttpUser):
    wait_time = between(1, 3)  # Think time between actions

    @task(3)  # Weight: 3x more likely than other tasks
    def browse_teams(self):
        self.client.get("/api/teams", headers=self.headers)

    @task(1)
    def update_profile(self):
        self.client.put("/api/users/me", json={"name": fake.name()})
The wait_time simulates human think time. Without it, your test is unrealistic — real users don’t fire requests at machine speed.
3.5 The Performance Benchmarking Engine
The benchmarking engine runs isolated micro-benchmarks on individual endpoints with precise timing, separate from the load tests. It answers the question: “Is the /api/teams endpoint getting slower across deployments?”
Why asyncio.gather() instead of a loop? Sequential requests measure serial latency. Concurrent requests reveal queuing effects — which is what real-world latency looks like.
The percentile calculation itself is three lines:
import numpy as np
p50 = np.percentile(latencies, 50)  # median
p95 = np.percentile(latencies, 95)  # 95th percentile
p99 = np.percentile(latencies, 99)  # worst 1%
3.6 Stress Testing — Finding the Breaking Point
The stress tester uses a binary search strategy to find the maximum sustainable RPS. It starts at a low RPS, doubles until error rate exceeds 5%, then binary-searches between the last good and first bad value. This finds the exact threshold in O(log N) steps instead of linear scanning.
Why binary search?
Linear scan:   Test at 10, 20, 30, 40 RPS...  (slow — O(N) probes)
Binary search: Test at 100, 50, 75, 62...      (fast — O(log N) probes)
Watch the binary search in action:
Probe 100 RPS  -->  12% errors  -->  too high  -->  search [5, 99]
Probe  52 RPS  -->   1.2% errors -->  OK        -->  search [53, 99]
Probe  76 RPS  -->   8.1% errors -->  too high  -->  search [53, 75]
Probe  64 RPS  -->   3.4% errors -->  OK        -->  ceiling found: ~64 RPS
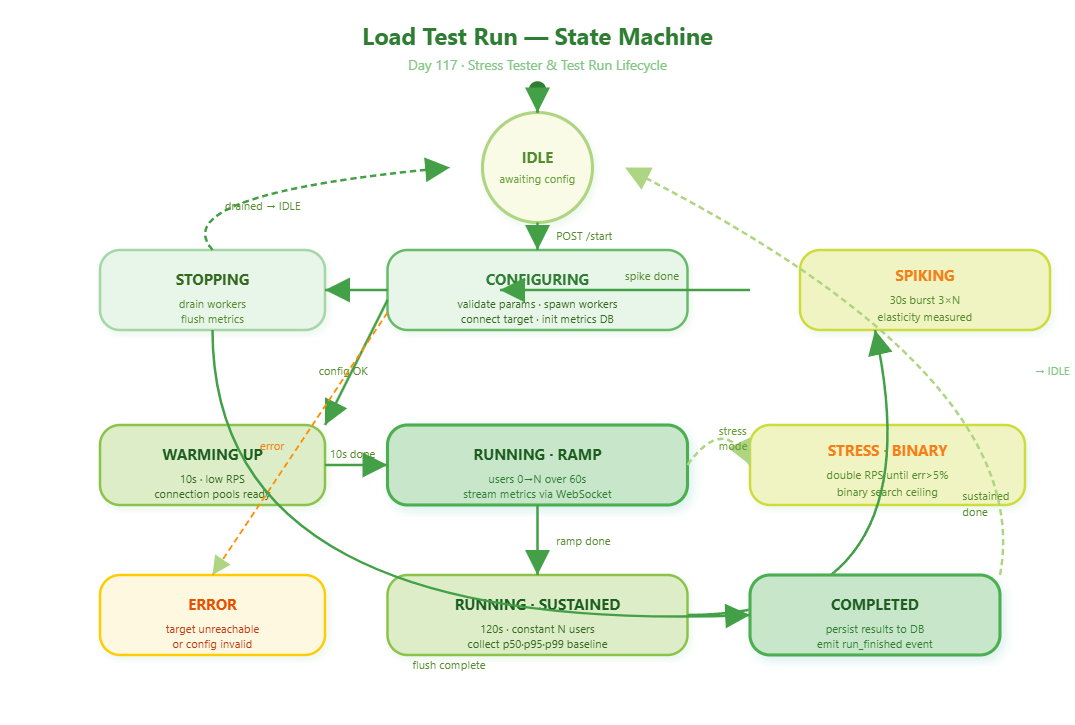
The stress tester moves through these states:
QUEUED  -->  STRESS_BINARY_SEARCH  -->  (probing RPS points)  -->  COMPLETED
                                   -->  ERROR  (if target unreachable)
Expected output after stress test completes:
Stress Result: Max sustainable RPS = 64.0 | Breakdown at 76.0 RPS3.7 Resource Monitoring
Pair this with database-level metrics (active connections, query time) and Redis metrics (hit rate, memory) for a complete picture. The resource that hits 100% first is your primary bottleneck — fix that before everything else.
3.8 WebSocket Streaming — Live Data to the Dashboard
Server side (FastAPI):
@router.websocket("/api/tests/ws/{run_id}")
async def websocket_metrics(websocket: WebSocket, run_id: str):
    await websocket.accept()
    # Register callback — runner calls this every 500ms
    async def send_metric(data):
        await websocket.send_text(json.dumps(data))
    runner.register_metric_callback(run_id, send_metric)
    # Keep connection alive with ping
    while True:
        await asyncio.wait_for(websocket.receive_text(), timeout=30)
Client side (React hook):
function useWebSocket(url) {
  const [messages, setMessages] = useState([]);
  useEffect(() => {
    const ws = new WebSocket(url);
    ws.onmessage = (evt) => setMessages(prev =>
      [...prev.slice(-300), JSON.parse(evt.data)]  // Keep last 300 points
    );
    return () => ws.close();
  }, [url]);
  return { messages };
}
The .slice(-300) on the messages array is not just cleanup — it prevents unbounded memory growth during long tests. At 2 data points/second over a 30-minute test, you’d accumulate 3,600 objects without it.
3.9 The React Dashboard
Styled to match k6 Cloud’s interface: dark header with run controls, split-panel layout with live throughput and latency charts on the left, resource gauges on the right, and a results history table at the bottom.
Three frontend patterns worth noting specifically:
WebSocket hook for real-time metric streaming — no polling delays, no stale data
Recharts AreaChart with
isAnimationActive={false}— animation at 100 data points/sec kills browsers; disable it on any live chartCircular gauge components for CPU/memory with color thresholds (green under 60%, yellow under 80%, red above 80%)
Part 4 — Build, Test and Run
4.1 Project Setup
Start by creating the directory structure. Everything lives under load-testing-platform/:
mkdir -p load-testing-platform/{backend,frontend,tests,logs,data}
mkdir -p load-testing-platform/backend/{app/{routers,models,services,core},locustfiles}
mkdir -p load-testing-platform/tests/{unit,integration}
Verify it’s correct:
find load-testing-platform -type d | sort
# Should show approximately 12 directories
Key library choices for the Python environment:
locust 2.32.2— industry-standard HTTP load generatoraiohttp— async HTTP for the benchmark engine (faster than httpx for bulk requests)psutil 6.1.0— cross-platform system metricsnumpy— percentile calculations (p50/p95/p99)
4.2 Running the Build Script
The build.sh script handles everything in one shot — environment setup, file creation, dependency installation, server startup, and test execution.
Without Docker:
chmod +x build.sh stop.sh
bash build.sh
With Docker:
bash build.sh docker
Expected terminal output, step by step:
====== Creating Project Structure ======
====== Setting Up Python Virtual Environment ======
  Installed: locust-2.32.2, fastapi-0.115.5, psutil-6.1.0 ...
====== Starting Backend Server ======
  Backend is ready!
====== Running Unit Tests ======
  tests/unit/test_benchmark.py::test_benchmark_runs         PASSED
  tests/unit/test_metrics.py::test_system_metrics_keys      PASSED
  tests/unit/test_runner.py::test_run_created               PASSED
====== Running Integration Tests ======
  tests/integration/test_api.py::test_health_endpoint       PASSED
  tests/integration/test_api.py::test_start_load_test       PASSED
  ... 8 passed
====== Running Functional Demonstration ======
  Health: ok
  Users: 5 returned (total: 500)
  Teams: 50 total
  Load test started. Run ID: a3f8c921-...
  Benchmark completed: 6 endpoints measured
     GET /api/health    p50= 5.2ms   p99= 18.4ms   rps=312.1
  Stress Result: Max sustainable RPS = 58.0 | Breakdown at 72.0 RPS
4.3 Manual API Testing
Once the server is running, you can drive every feature from the command line. Work through these in order:
# 1. Confirm the target API is alive
curl http://localhost:8117/api/health

# 2. Start a load test
curl -X POST http://localhost:8117/api/tests/start \
  -H "Content-Type: application/json" \
  -d '{"name":"Manual Test","test_type":"load","target_url":"http://localhost:8117","users":10,"duration_seconds":20}'
# Response: {"run_id": "abc123...", "status": "started"}

# 3. Poll the run status (replace <RUN_ID> with the id from step 2)
curl http://localhost:8117/api/tests/runs/<RUN_ID>

# 4. Start an endpoint benchmark
curl -X POST http://localhost:8117/api/tests/start \
  -H "Content-Type: application/json" \
  -d '{"name":"Benchmark","test_type":"benchmark","target_url":"http://localhost:8117"}'

# 5. Start a stress test
curl -X POST http://localhost:8117/api/tests/start \
  -H "Content-Type: application/json" \
  -d '{"name":"Stress","test_type":"stress","target_url":"http://localhost:8117","error_threshold_percent":5}'

# 6. Check current system resource metrics
curl http://localhost:8117/api/system/metrics

# 7. List all test runs ever executed
curl http://localhost:8117/api/tests/runs
4.4 Standalone Locust (Advanced)
For more realistic load testing with the actual Locust web UI — the one engineers use day-to-day — run it standalone:
cd load-testing-platform
source .venv/bin/activate
cd backend

locust -f locustfiles/user_journeys.py \
  --host http://localhost:8117 \
  --web-port 8089
Open
http://localhost:8089
, set Users=20, Spawn rate=2, Duration=60s, and start. You’ll see a live table like this:
Name                    Reqs   Fails  Avg    Min   Max    p95    p99    RPS
GET /api/users          1234    0      42     18    234    89     145    18.2
GET /api/teams           312    0      31     12     98    67      92     4.6
PUT /api/users/{id}      156    0      78     41    312   145     201     2.3
4.5 Dashboard Verification
Open
http://localhost:3117
and walk through each panel to confirm everything is working:
Panel What You Should See KPI cards RPS, Error Rate, Run ID, Test Type — all updating live Throughput chart Area chart climbs during ramp, flattens during sustained load Latency chart p50 stays low; p99 may spike during stress phases CPU gauge Color shifts green → yellow → red as load climbs Memory gauge Reflects actual system memory, correlated with test intensity Benchmark table p50/p95/p99 per endpoint populated after benchmark completes Stress result card Max sustainable RPS and breakdown threshold displayed Run history All completed runs listed, sortable by status
4.6 Stopping Everything
bash stop.sh
# Backend stopped
# Frontend stopped
# All services stopped.
Part 5 — Success Criteria
After the build completes and the dashboard is open, check off each item:
Load test starts via UI, runs for the configured duration, and stops cleanly
Live charts update every 2 seconds showing RPS and latency in real time
Benchmark report shows p50/p95/p99 for each endpoint
Stress test identifies the exact RPS where error rate exceeds 5%
Resource monitor shows CPU and memory correlated with the load phases
Historical test runs are stored and remain accessible after restart
Part 6 — Troubleshooting
When something goes wrong, check here first before digging into logs:
Symptom Fix ModuleNotFoundError Run source .venv/bin/activate before anything else Backend port already in use lsof -i :8117 to find the process, then kill it Integration tests failing The backend must be running first — check logs/backend.log Frontend loads blank page Check logs/frontend.log; confirm Node.js 18+ is installed Stress test shows 0 RPS The target URL must respond; verify /api/health manually first WebSocket not connecting CORS is set to * already — open the browser console for the actual error
Part 7 — Real-World Context
These aren’t hypothetical patterns. This is what teams at well-known companies actually do:
Stripe runs load tests in a dedicated shadow environment that mirrors production traffic patterns from the previous week. The test is considered passing only if p99 latency stays under their SLA — typically 300ms for payment APIs.
GitHub Actions replays 7 days of historical job submissions as synthetic load before deploying changes to their runner infrastructure. If queue depth exceeds a threshold, the deploy is automatically blocked.
Cloudflare runs continuous low-level load tests 24/7 against every Point of Presence. Any deviation from the baseline latency profile triggers automatic rollback of recent config changes.