Day 111: Analytics UI
Building the Intelligence Layer of Your Infrastructure Platform
What We Are Building Today
By the end of this lesson you will have a fully functional analytics command center — the kind of interface Datadog, New Relic, and Grafana charge enterprise teams thousands of dollars a month for. Here is exactly what we are shipping:
A live KPI dashboard with real-time WebSocket-powered metric cards and Recharts trend lines
An ML model interface for on-demand infrastructure anomaly prediction with feature importance visualization
A BI reporting panel with drag-to-configure report builder, schedule management, and multi-format export
A correlation viewer that computes and renders an interactive heat map showing which infrastructure metrics move together
An analytics configuration panel for data sources, alert thresholds, and user preferences — all persisted to PostgreSQL
Everything connects cleanly to the reporting engine from Day 110 and the user management system from earlier this week.
Why Analytics UI Matters in Distributed Systems
Every infrastructure platform reaches the same inflection point: you have the data, but nobody can act on it because there is no interface that surfaces the right signal at the right moment. The UI is not a cosmetic layer — it is the feedback loop that closes the control plane.
Grafana solved this for time-series metrics. Tableau solved it for business data. What makes infrastructure analytics different is the need to simultaneously show operational data (latency, error rates, queue depths) alongside business data (user growth, revenue impact of incidents) and ML-derived signals (predicted failure probability). None of the commercial tools do all three cleanly in a single coherent surface. That is exactly what we build today.
Component Architecture
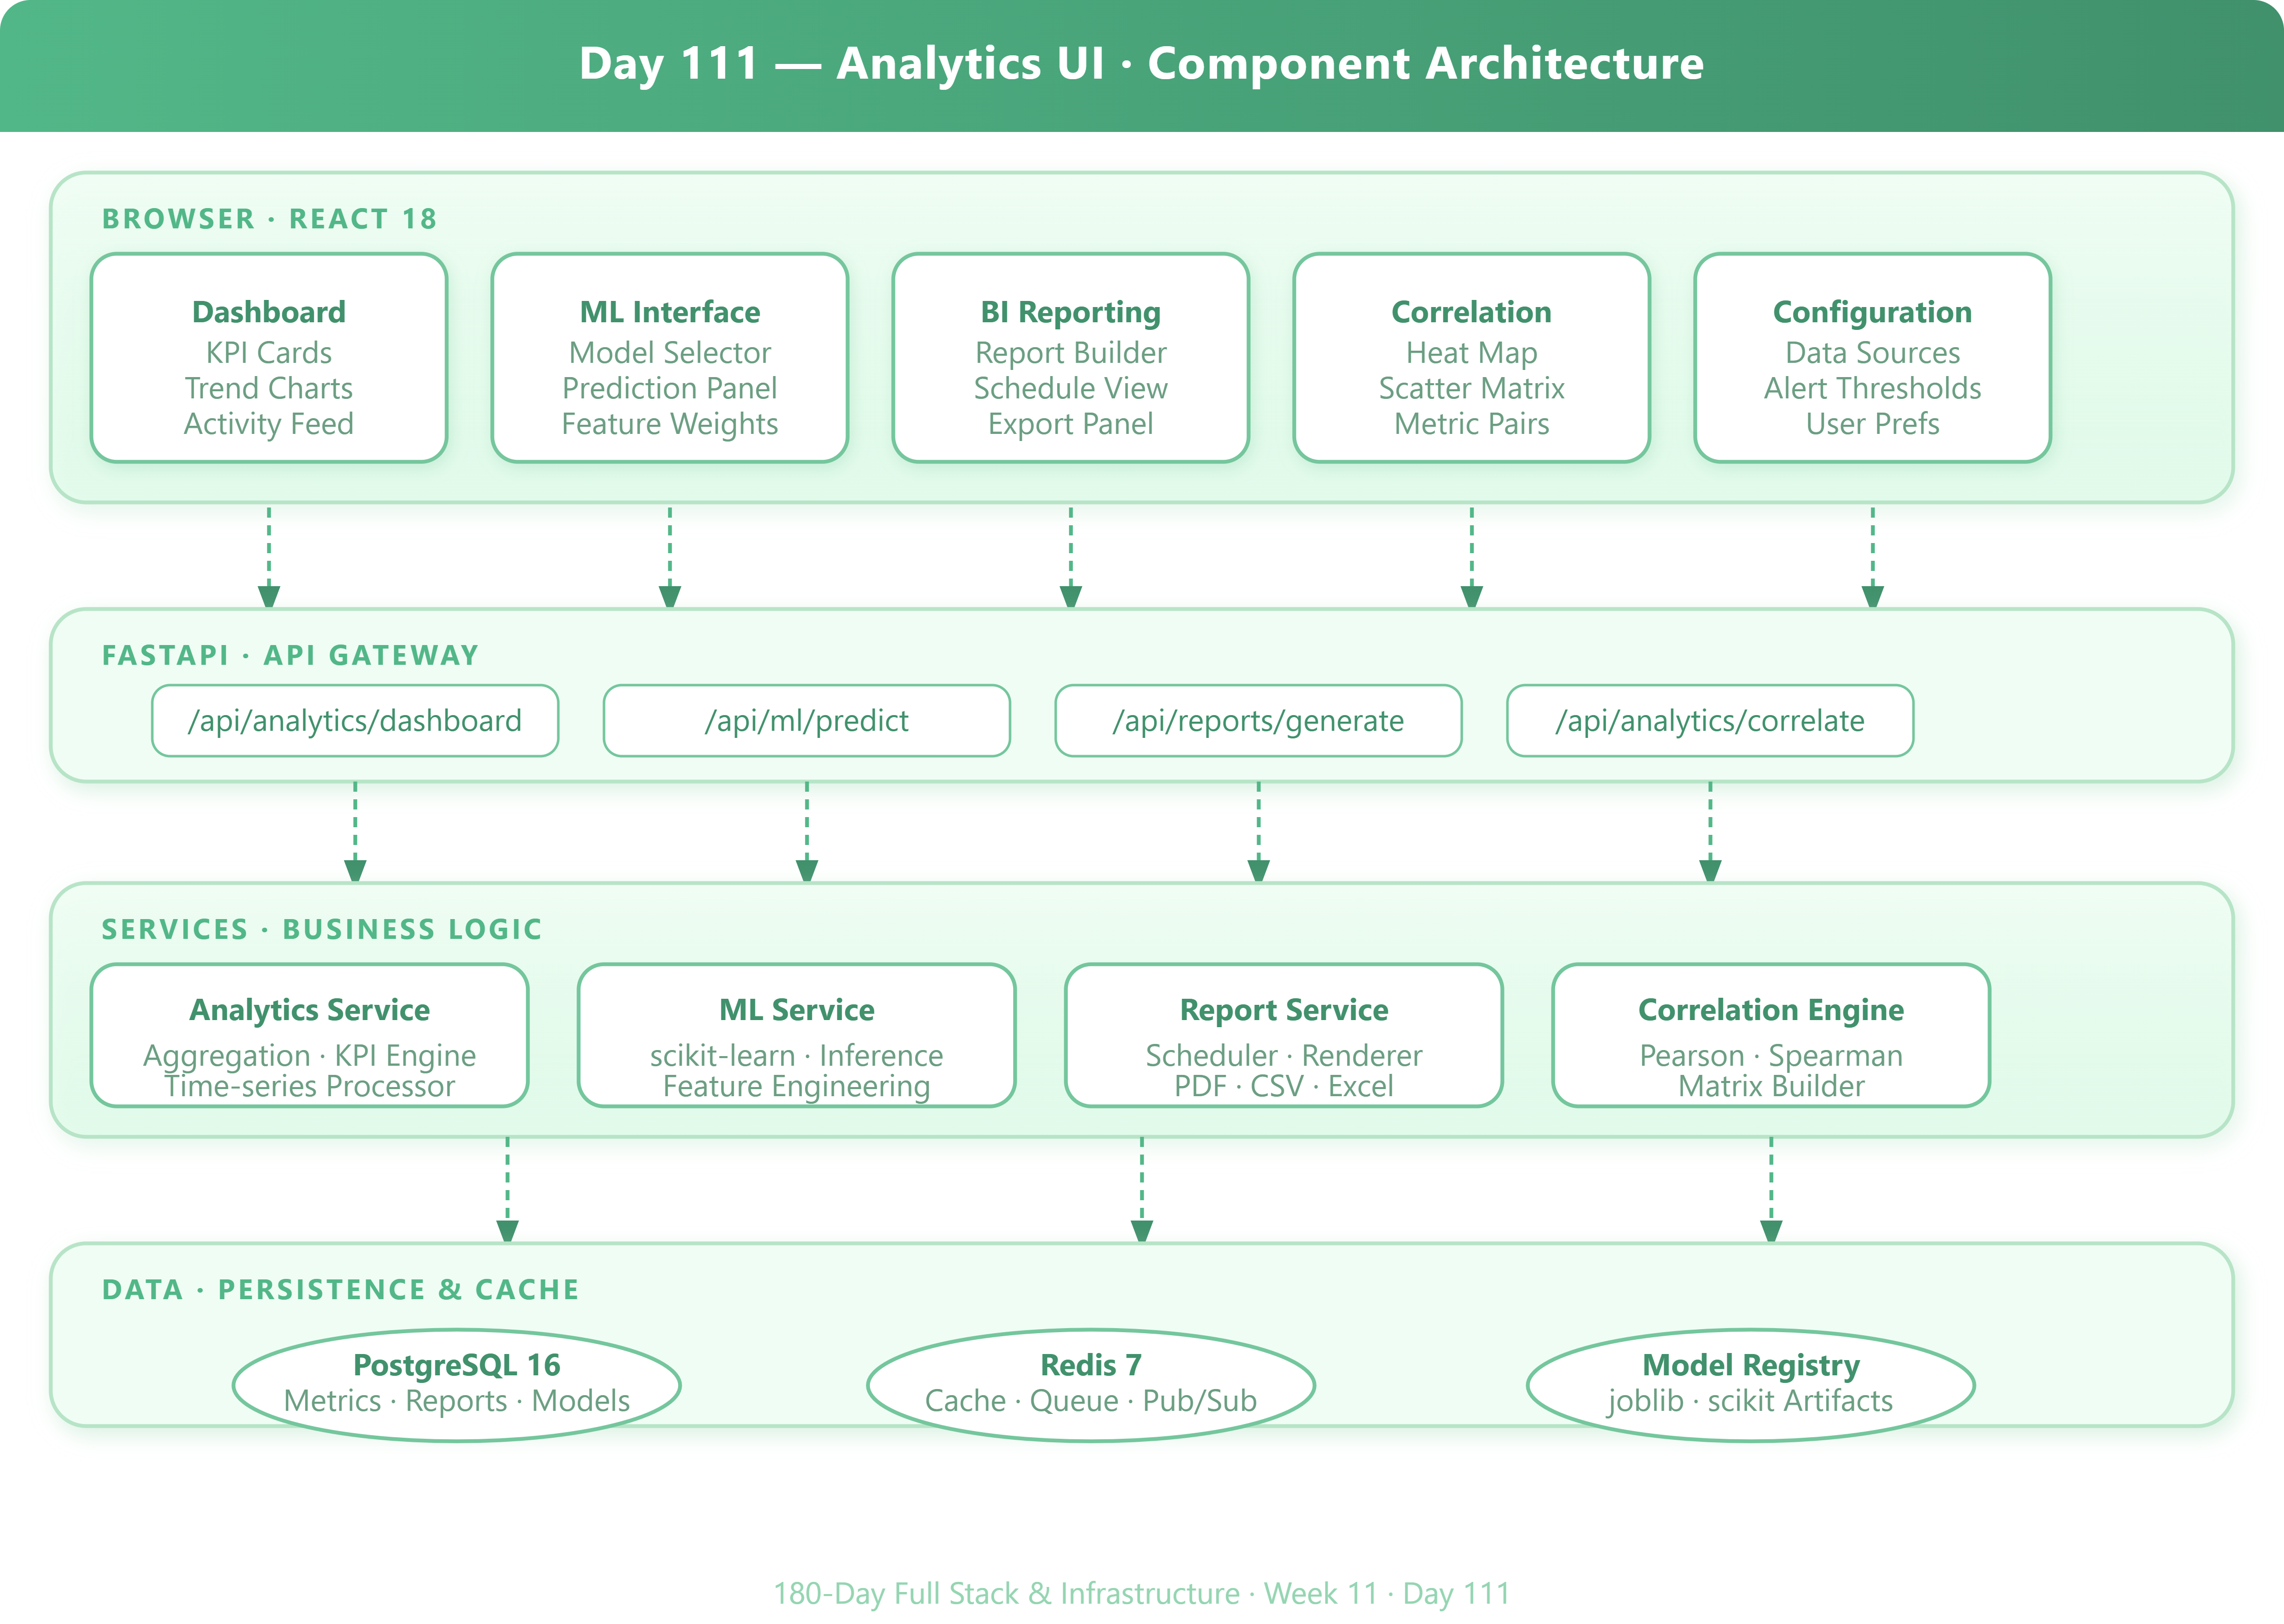
The system is organized in four horizontal layers, each with a single responsibility:
Browser (React 18) — Five top-level page components: Dashboard, ML Interface, BI Reporting, Correlation Viewer, and Configuration. Each component owns a slice of React state and communicates exclusively through a central analyticsStore (Zustand).
API Gateway (FastAPI) — Thin routing layer. Each React page maps to one FastAPI router. JWT authentication and request validation happen here. The routers delegate immediately to the service layer and never contain business logic.
Service Layer (Python) — This is where the interesting work happens. The