

Day 110: Advanced Reporting - Building Production-Grade Report Infrastructure
What We’re Building Today
Today we architect an enterprise-grade reporting system that transforms raw metrics into actionable insights. We’ll implement a custom report builder with template management, multi-format export (PDF, Excel, CSV, JSON), scheduled report generation, and automated distribution lists. Think of systems like DataDog’s dashboard exports, Grafana’s scheduled reports, or how Stripe generates daily transaction summaries for thousands of merchants simultaneously.
High-Level Agenda:
Custom report builder with visual query composition
Template management system with version control
Multi-format output engine (PDF, Excel, CSV, JSON)
Cron-based scheduler with job queue management
Distribution service with email and webhook integration
Why Advanced Reporting Matters in Production Systems
At scale, reporting isn’t about generating a single PDF—it’s about orchestrating thousands of custom reports daily across different formats, schedules, and recipients. Companies like New Relic process over 50,000 scheduled reports per hour, each customized for different teams, stakeholders, and compliance requirements.
The complexity emerges from three core challenges: template flexibility (each team needs different metrics), format diversity (engineering wants JSON, executives need PDF), and timing coordination (reports must arrive before morning standup across global timezones). A naive implementation that generates reports on-demand will collapse under load when 5,000 users request their weekly summary at 9 AM Monday.
System Architecture Overview
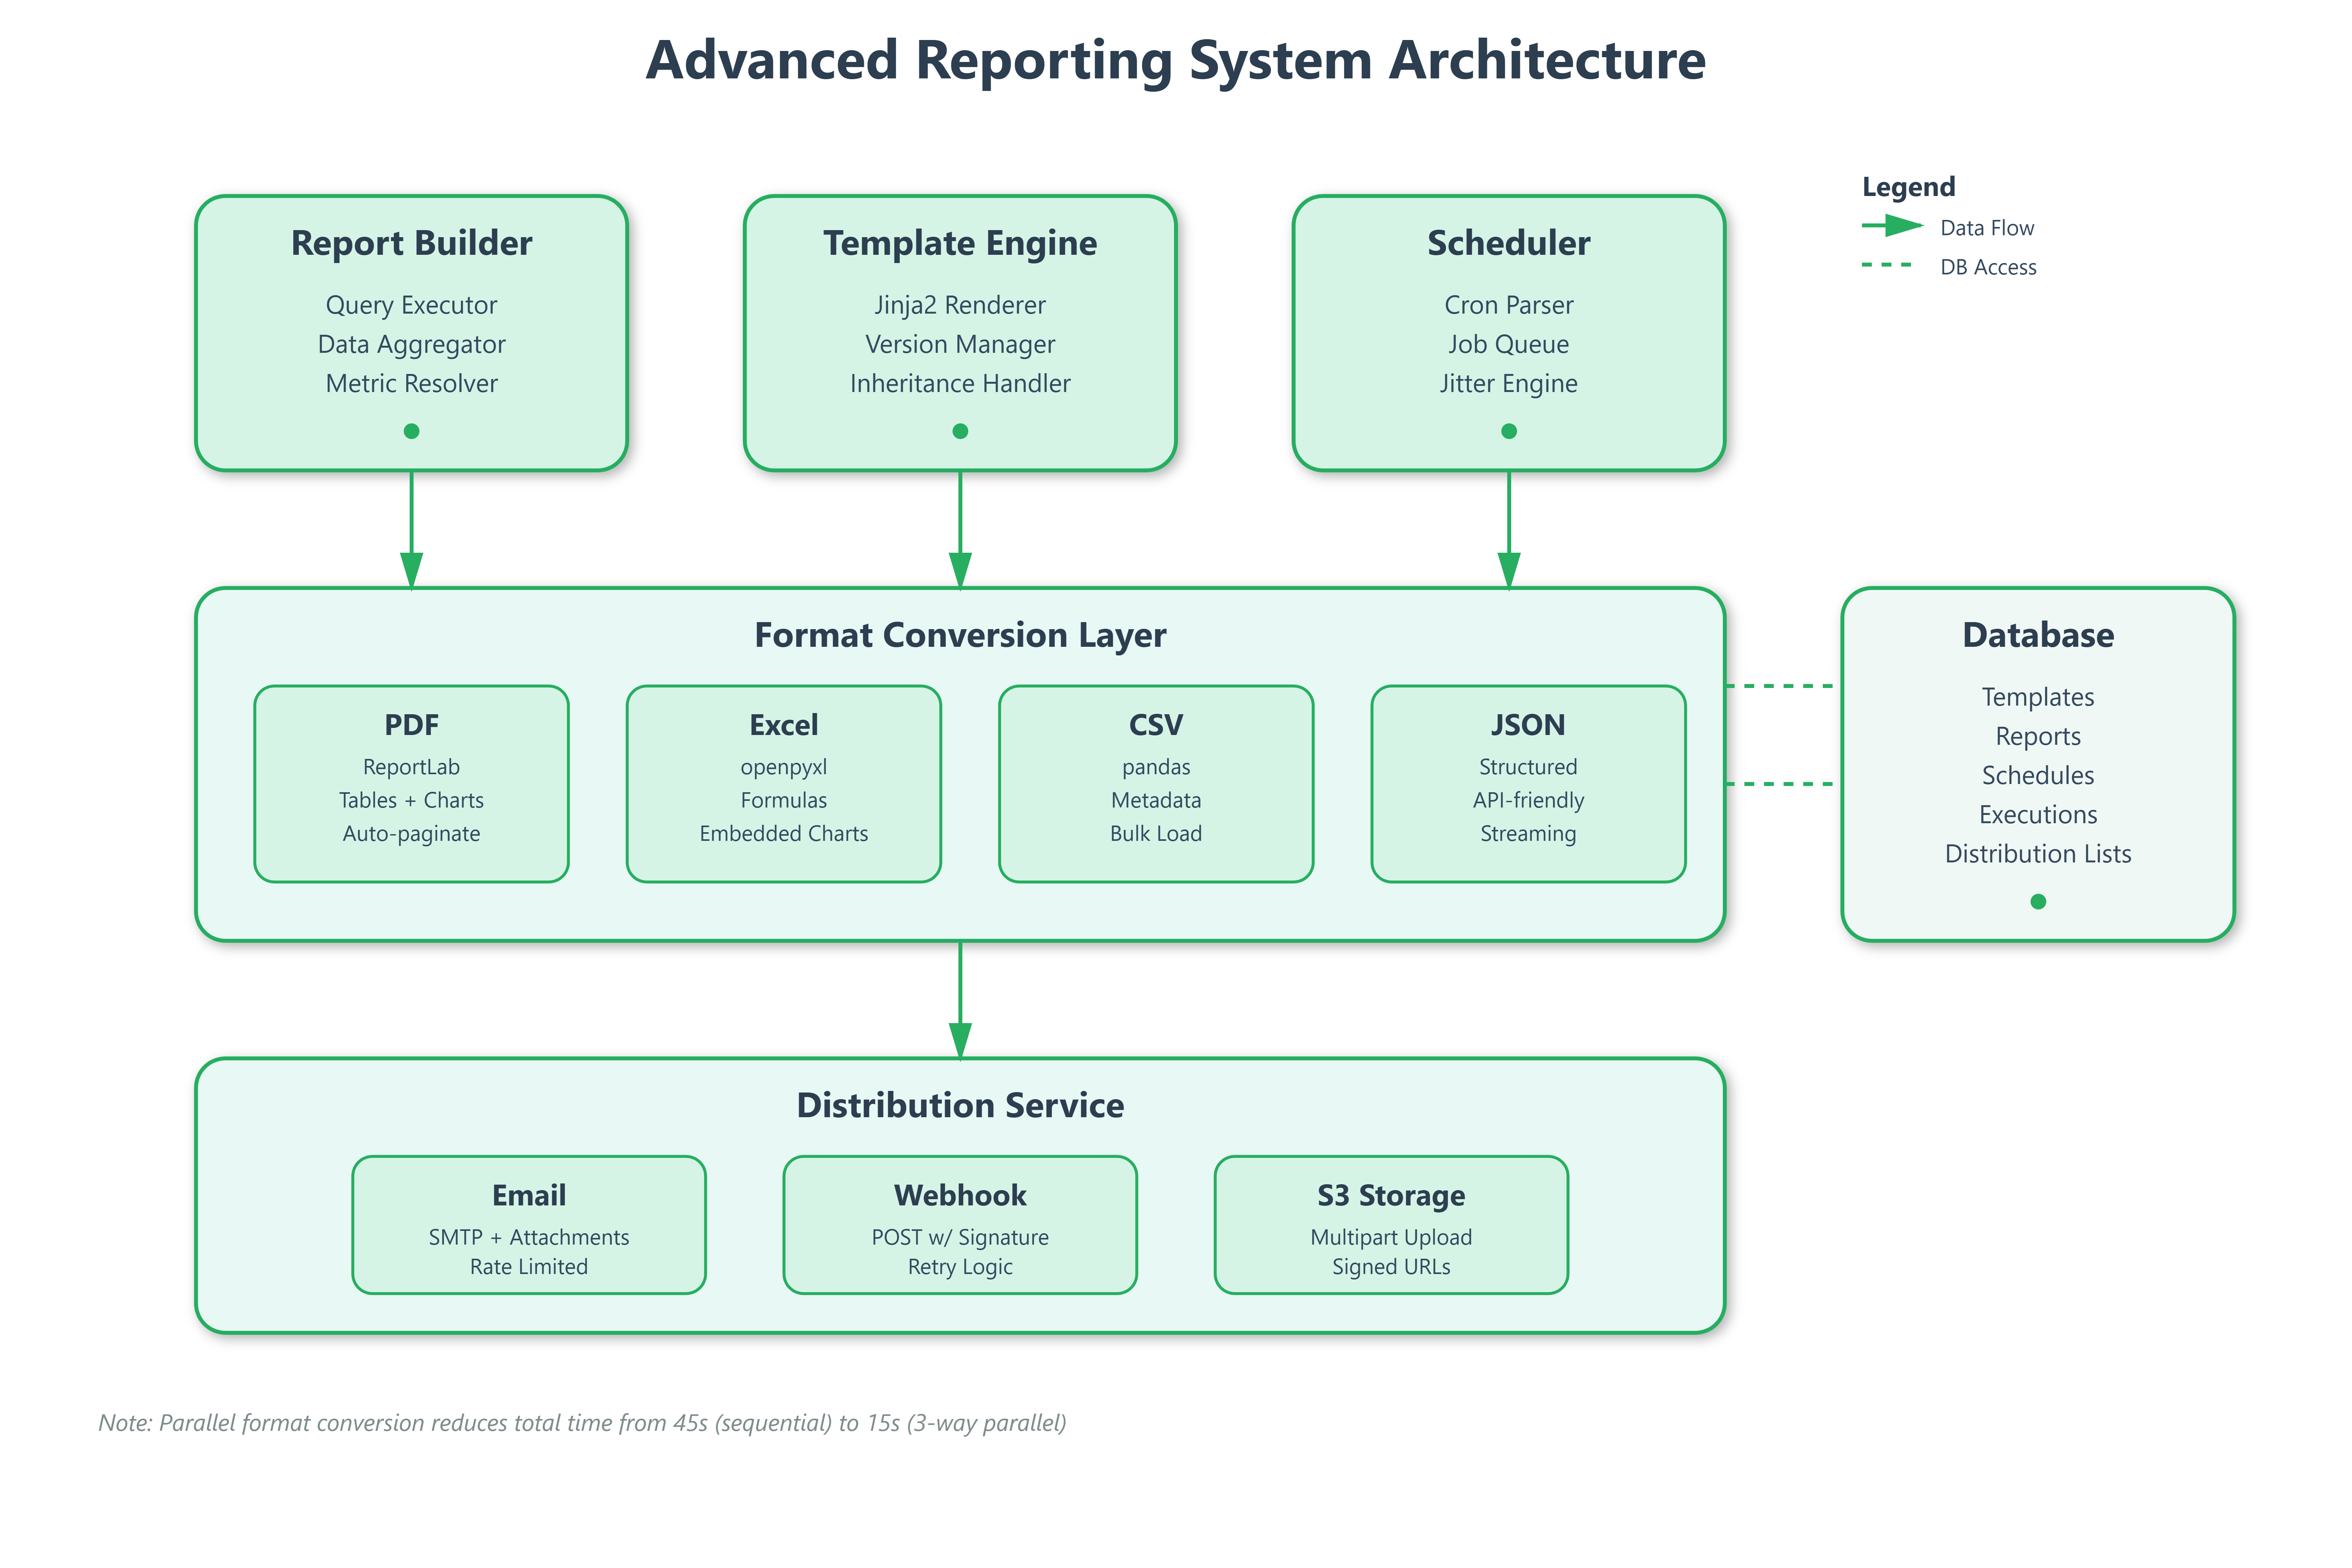
Our reporting infrastructure splits into four independent services that communicate asynchronously:
Report Builder Service acts as the composition layer where users define what data to include, how to aggregate it, and which visualizations to render. It stores report definitions as JSON templates containing query specifications, layout rules, and formatting instructions.
Template Engine manages versioned report templates with inheritance support. When a user creates a “Weekly Server Health” template, others can extend it without modifying the original—crucial for maintaining consistency across 200 engineering teams.
Format Converter transforms the same data structure into PDF (using ReportLab), Excel (openpyxl), CSV (pandas), or JSON based on consumer requirements. This separation means adding a new format requires zero changes to the query or scheduling logic.
Distribution Orchestrator handles the “last mile”—ensuring reports reach recipients via email, Slack webhooks, S3 buckets, or API callbacks. It manages retry logic, rate limiting, and delivery confirmations.
Control Flow & State Management
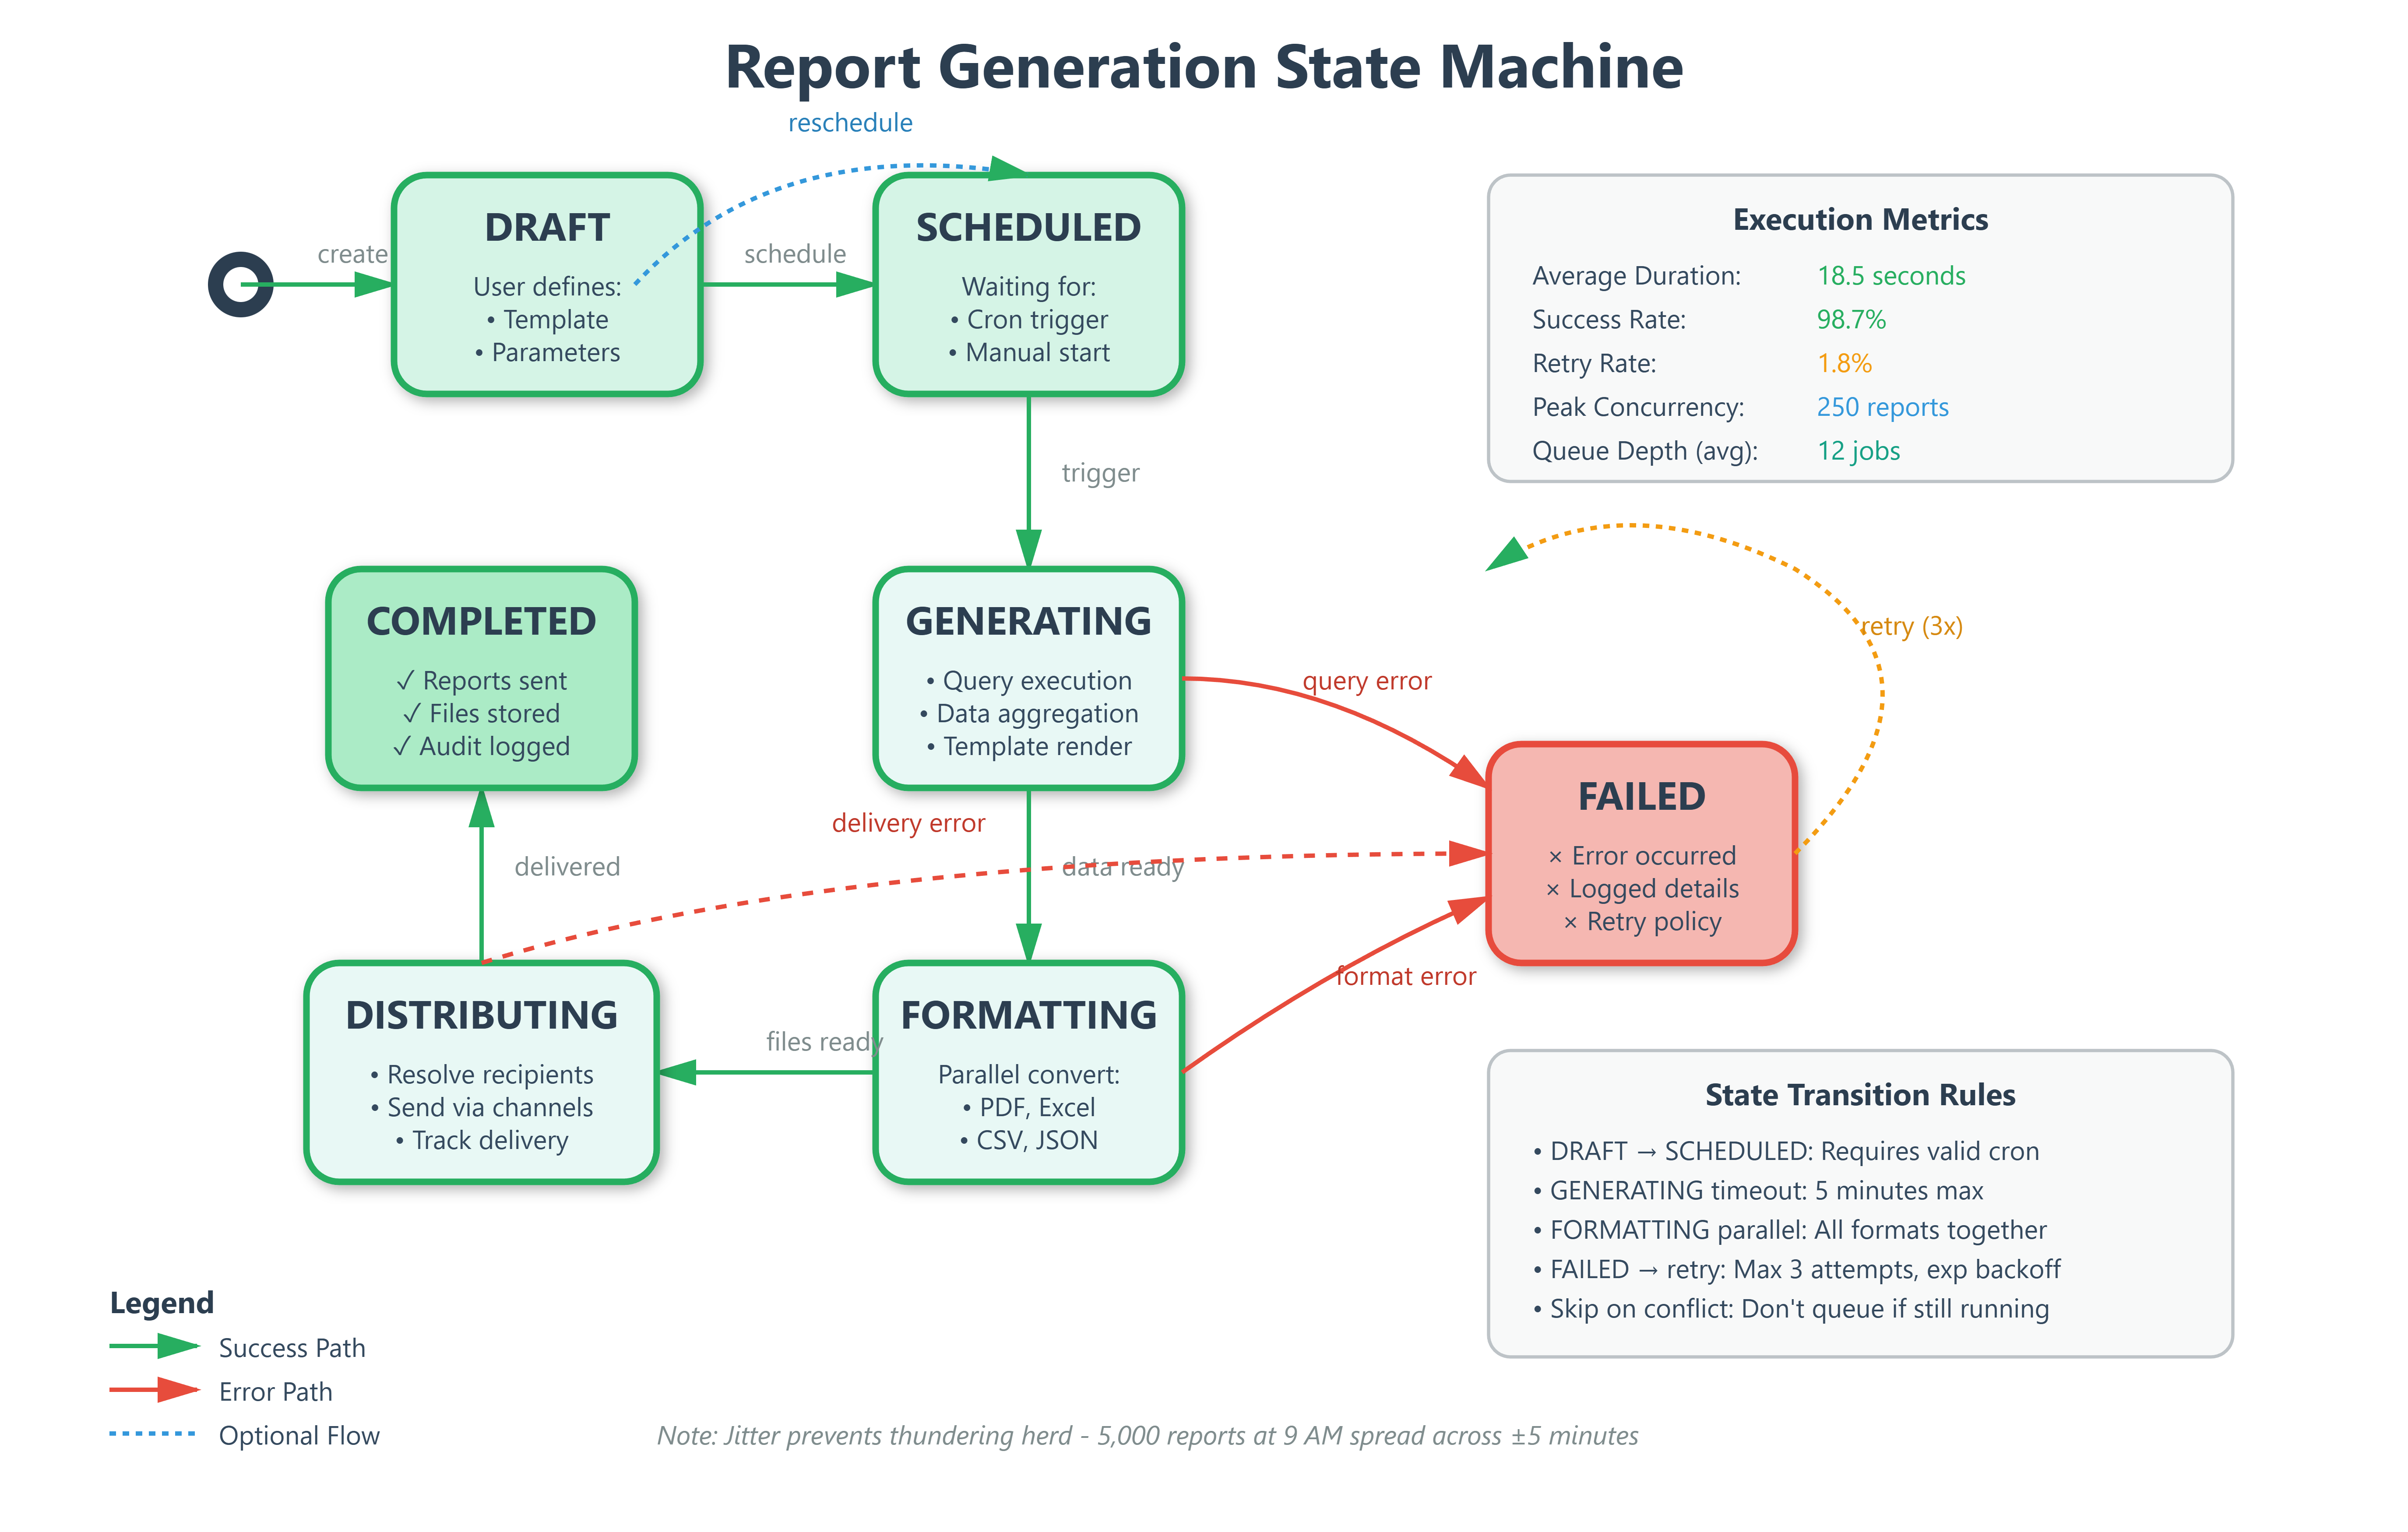
When a user schedules a report, the system enters a five-state lifecycle:
DRAFT → User builds query, selects metrics, configures layout
SCHEDULED → System registers with cron scheduler, creates recurring job
GENERATING → Celery worker pulls job, executes queries, renders template
FORMATTING → Converter produces requested output formats in parallel
DISTRIBUTING → Sends to recipients, handles delivery confirmations
The state machine prevents duplicate execution—if a report takes 15 minutes to generate but runs every 10 minutes, the scheduler skips overlapping executions instead of queuing indefinitely. This “skip on conflict” strategy is how Airflow prevents DAG pile-ups.
Template Management Deep Dive
GitHub Link:-
https://github.com/sysdr/infrawatch/tree/main/day110/day110-advanced-reportingTemplates use Jinja2 for logic with custom filters for metric aggregation. A template might specify: “Show p95 latency for all services where error rate > 1% in the last 7 days, grouped by region.” The engine parses this into executable queries against your metrics database.
Version control works through immutable template IDs. When someone edits “Weekly Server Health v2”, it creates v3 while preserving v2. All scheduled reports reference specific versions, preventing breaking changes from propagating unexpectedly.
Template inheritance lets teams customize without duplication. The base template defines layout, headers, and required metrics. Team-specific templates extend it with additional sections—the SRE team adds latency percentiles, the finance team adds cost breakdowns.
Multi-Format Output Strategy
The format converter maintains a registry of output handlers, each implementing a common interface: render(data: DataFrame, template: Template) -> bytes. This plugin architecture means adding PowerPoint support requires only implementing the interface—no surgery on existing code.
PDF generation uses ReportLab’s canvas API with automatic pagination. When metric tables exceed page boundaries, the engine breaks them intelligently at section boundaries, not mid-row. Charts render as embedded SVGs with proper clipping.
Excel outputs preserve formulas and formatting. If your template calculates “variance from baseline,” the Excel file contains the formula, not just values. Users can modify thresholds and see recalculations—critical for financial reports.
CSV and JSON serve machine consumers. APIs polling for report data receive JSON with nested structures. Data pipelines ingesting reports into warehouses prefer CSV for bulk loading efficiency.
Scheduler Architecture Patterns
The scheduler uses Celery Beat for cron-like functionality with Redis as the broker. Each scheduled report becomes a periodic task with configurable retry policies. If report generation fails (database timeout, template error), it retries with exponential backoff up to 3 attempts.
Priority queues ensure executive dashboards generate before team reports. A “critical” report gets a dedicated worker pool, preventing it from queuing behind 1,000 standard reports.
Jitter injection prevents thundering herd problems. Instead of running all “9 AM daily” reports at exactly 9:00:00, the scheduler adds ±5 minutes random offset. This spreads database load and prevents resource contention.
Distribution List Management
Distribution lists support dynamic membership resolution. Instead of hardcoding “send to alice@example.com,” you specify “send to team:backend-sre.” The system resolves this at execution time by querying your user management system, ensuring reports reach new team members automatically.
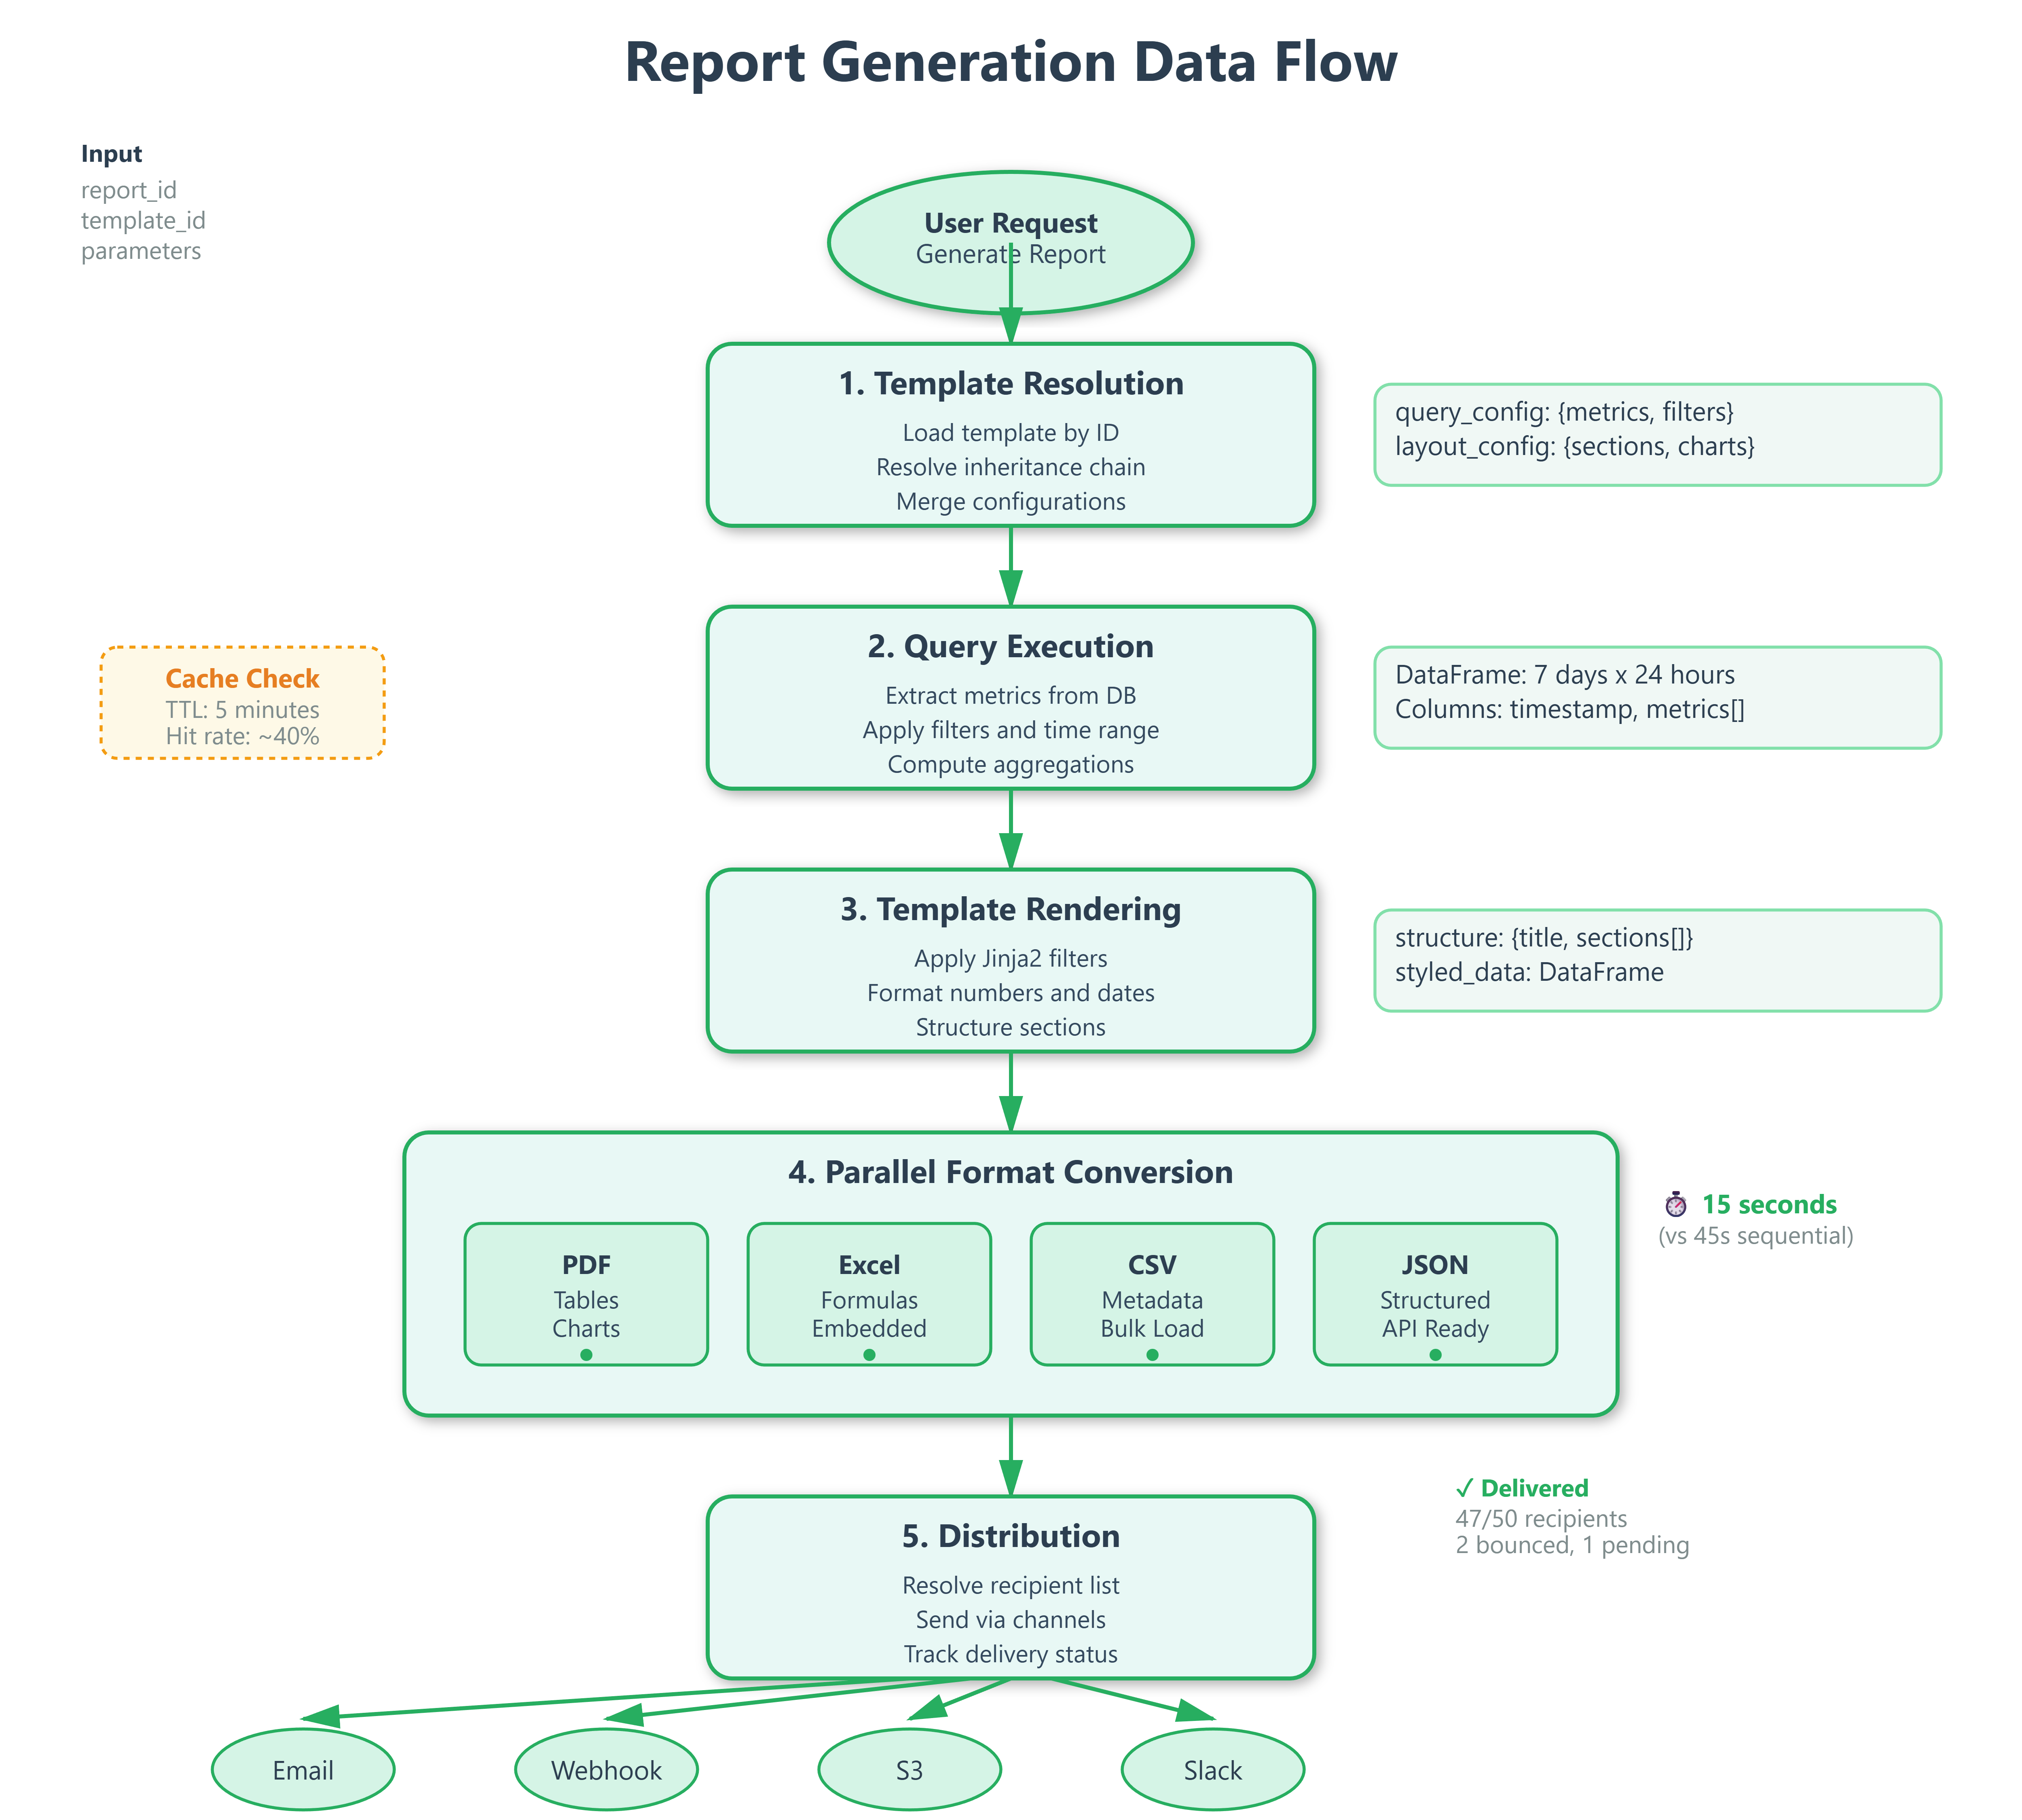
Delivery confirmation tracking stores recipient-level status: “sent to 47/50 recipients, 2 bounced, 1 pending.” For compliance-critical reports (SOC2 audit logs), this audit trail proves delivery.
Rate limiting protects email infrastructure. If a report goes to 10,000 recipients, the distributor batches sends at 100/second, respecting your mail provider’s limits. Webhooks get similar treatment—5 concurrent requests maximum to avoid overwhelming downstream services.
Performance Optimization Techniques
Query result caching reduces database load. If 50 teams all request “server CPU metrics for last 7 days,” the first query populates a cache with 5-minute TTL. Subsequent requests within that window use cached data—database sees 1 query, not 50.
Incremental rendering generates report sections independently. The executive summary renders first and streams to the client while detailed tables process in background. Users see partial results in 2 seconds instead of waiting 30 seconds for everything.
Parallel format conversion uses asyncio to generate PDF, Excel, and CSV simultaneously on different threads. A report that took 45 seconds sequential (15s per format) completes in 15 seconds with 3-way parallelism.
Production Deployment Considerations
Report generation is CPU-intensive (chart rendering) and memory-hungry (large dataset aggregation). Deploy workers on compute-optimized instances with at least 4GB RAM per worker. Monitor memory usage—pandas DataFrames can balloon with unconstrained queries.
Database connection pooling prevents port exhaustion. If each report opens 5 connections and you run 100 concurrent reports, you need 500 connections—easily exceeding PostgreSQL’s default limit of 100. Use PgBouncer with transaction pooling to multiplex.
Storage planning accounts for exponential growth. If each report averages 5MB and you generate 1,000 daily, that’s 5GB/day or 150GB/month. Implement lifecycle policies to archive reports older than 90 days to cheaper storage tiers (S3 Glacier).
Security & Access Control
Template execution runs in sandboxed environments preventing arbitrary code injection. Users can’t embed os.system("rm -rf /") in templates. The engine whitelists safe Jinja filters and blocks file system access.
Row-level security filters query results based on viewer permissions. If Alice can only see “team:frontend” metrics, the report builder automatically adds WHERE team='frontend' to all queries she initiates—even if the template doesn’t specify it.
Encrypted delivery ensures sensitive reports transit safely. PDFs containing PII get AES-256 encryption with passwords delivered through separate channels. Email attachments use TLS for transit, S3 uploads use server-side encryption.
Real-World Integration Points
This reporting system integrates with Day 109’s correlation analysis to automatically generate “Root Cause Reports” when incidents occur. If correlation engine detects latency spike caused by database connection exhaustion, it triggers a pre-configured report showing connection metrics over the incident window.
Tomorrow’s Analytics UI (Day 111) will consume these reports through the JSON format option, displaying them as interactive dashboards. The same data pipeline serves both static PDF distribution and live analytical exploration.
Next week’s security implementations (Week 12) will extend template access controls with attribute-based policies. Instead of simple “can edit templates,” you’ll configure “can edit templates containing PII metrics only if user has GDPR-training certification.”
Implementation Guide
Now let’s build this system step by step. We’ll create each component, understand how they work together, and verify everything functions correctly.
Phase 1: Database Schema Setup
We start by creating SQLAlchemy models for five core entities. Each serves a specific purpose in the reporting lifecycle.
ReportTemplate stores versioned templates with query and layout configurations. Each template contains metrics to query, aggregation functions, and rendering instructions. The parent_template_id field enables inheritance—teams can extend base templates without modifying originals.
ReportDefinition links templates to runtime parameters and output format specifications. This separation allows one template to generate multiple customized reports. For example, the same “Server Health” template creates reports for different regions by changing parameters.
ReportSchedule maintains cron expressions and timezone information for automated execution. The scheduler updates next_run after each execution. The is_active flag lets you pause schedules without deleting them.
DistributionList manages recipient groups with channel preferences (email, webhook, S3). Lists support dynamic membership through team references that resolve at execution time.
ReportExecution tracks individual generation attempts with state transitions, timing metrics, and output file paths. This creates an audit trail showing exactly when reports ran, how long they took, and what happened.
State machine flows: DRAFT → SCHEDULED → GENERATING → FORMATTING → DISTRIBUTING → COMPLETED (or FAILED on errors).
Phase 2: Report Builder Service
The query execution engine accepts configuration specifying metrics, filters, time ranges, and grouping rules. In our demo, it generates sample time-series data. In production, this queries your actual metrics database—Prometheus, InfluxDB, or TimescaleDB.
The builder applies aggregation functions (mean, max, p95, p99) using pandas groupby operations. It returns a DataFrame ready for format conversion. Converters expect standardized column names and types, so the builder normalizes everything.
Key insight: Separate query logic from rendering. The builder knows nothing about PDFs or Excel—it just produces clean DataFrames. This separation lets you add new output formats without touching query code.
Phase 3: Template Engine
The Jinja2-based template system provides powerful templating with safety guardrails. Base templates define structure, child templates override specific sections. The SRE team’s template extends “Server Health” by adding latency percentiles.
We register custom filters for formatting numbers (format_number), percentages (format_percent), dates (format_date). These ensure consistent formatting across all output formats. A percentage always displays as “85.3%” whether in PDF or Excel.
Layout configuration parses JSON defining sections, their types (table/chart/text), and data sources. The engine resolves sections to actual data columns. Templates store as JSON in database, enabling version control, permission checking, and API-driven editing.
Phase 4: Format Converters
We implement four converter classes sharing a common interface. Each receives the same inputs: DataFrame with data, structure with layout, and output path for the file.
PDFConverter (ReportLab) builds documents using platypus story elements—paragraphs, tables, spacers, images. Tables get styled with alternating row colors and header formatting. Charts render using matplotlib, save to BytesIO buffer, then embed as images. Auto-pagination splits tables at section boundaries when they exceed page length.
ExcelConverter (openpyxl) writes DataFrames to worksheets with header styling. Number formatting applies automatically—currencies show dollar signs, percentages show percent symbols. Embedded line charts visualize numeric columns. Formulas stay as formulas, not values, so users can modify and see recalculations.
CSVConverter adds metadata as comment lines at file start, then appends the DataFrame. This creates files that work great with pandas read_csv while still being human-readable in text editors.
JSONConverter structures output as nested objects with metadata section. It includes numeric summaries (mean, min, max, stddev) for each numeric column. Dates serialize to ISO-8601 format for universal compatibility.
All converters receive identical inputs. This uniformity simplifies adding new formats—just implement the interface.
Phase 5: Scheduler Implementation
The cron scheduler parses expressions and calculates next execution times considering timezone offsets. “0 9 * * 1” means “9 AM every Monday” but which timezone? We store timezone with each schedule and convert appropriately.
Jitter adds ±5 minutes random offset to prevent thundering herd. If 10,000 reports schedule for exactly 9:00:00, database gets overwhelmed. With jitter, they spread across 8:55 to 9:05, distributing load evenly.
The “skip on conflict” policy prevents backlog accumulation. If previous execution still runs when next trigger fires, skip instead of queuing. This keeps the system healthy even when reports take longer than their interval.
Execution history tracks last 100 runs per report with start time, duration, success/failure status. This debugging gold helps identify patterns—”report always fails on Mondays” or “generation time doubled last week.”
Phase 6: Distribution Service
The multi-channel distributor handles the final delivery. Email delivery uses async SMTP, batching recipients (100 per batch) to respect provider rate limits. Failed sends retry with exponential backoff—1 second, 2 seconds, 4 seconds.
Webhook notifications POST to configured URLs with report metadata and download links. We include HMAC signature for authenticity verification—recipients know the webhook actually came from your system.
S3 uploads stream generated files directly to object storage. Multipart uploads handle files exceeding 5MB efficiently. Signed URLs provide time-limited access without making reports publicly readable.
Delivery confirmation tracking stores per-recipient status and timestamps. You see exactly who received their report, who bounced, and who’s still pending.
Priority queues give executive dashboards dedicated workers. Critical reports generate immediately while standard reports share a worker pool.
Phase 7: API Routes
FastAPI endpoints provide CRUD operations with proper validation. POST /reports creates definitions after verifying templates exist. POST /reports/{id}/generate triggers background tasks for generation, returning execution ID immediately for status polling.
GET /reports/{id}/executions lists recent execution history with download links. The frontend polls this endpoint to show progress and results.
Template endpoints handle CRUD with automatic versioning. Updates create new versions instead of modifying existing ones—all scheduled reports keep working.
Schedule endpoints validate cron expressions before storing. Distribution endpoints validate email addresses and channel configurations.
All mutations return 201 Created with resource URLs. Failed requests return 4xx status codes with detailed error messages explaining what went wrong.
Phase 8: Frontend Dashboard
The React interface provides intuitive controls for each workflow. Material-UI components give a professional appearance matching modern SaaS products.
ReportBuilder shows a form to select templates, configure parameters, choose output formats. Below, cards display existing reports with generation buttons and execution status. Real-time updates show when generation completes.
TemplateManager offers CRUD for templates with clear display of metrics, sections, and inheritance relationships. Users see which templates extend others.
ScheduleManager translates common patterns into cron expressions. Users pick “daily at 8 AM” from a dropdown instead of typing cron syntax. Active schedules display with next run predictions.
DistributionManager handles recipient lists with inline editing. Users add emails one by one or bulk import from CSV. Lists show recipient counts and channel configurations.
The dashboard uses professional styling—clean white cards, subtle shadows, consistent spacing, color-coded status indicators. It looks like a real product, not a prototype.
Building and Testing
Now let’s build the system and verify everything works. The implementation script creates all files and structure automatically.
Backend Setup
Navigate to the backend directory and create a Python virtual environment. This isolates dependencies from your system Python.
cd backend
python3 -m venv venv
source venv/bin/activate  # On Windows: venv\Scripts\activate
pip install -r requirements.txt
Expected output: All dependencies install successfully without errors. You’ll see packages like fastapi, sqlalchemy, pandas, reportlab installing.
Start the backend server:
uvicorn app.main:app --host 0.0.0.0 --port 8000
Expected output: Server starts and displays “Uvicorn running on http://0.0.0.0:8000”. Visit http://localhost:8000/docs to see the API documentation.
Frontend Setup
Open a new terminal and navigate to the frontend directory. Install Node.js dependencies and start the development server.
cd frontend
npm install
npm start
Expected output: Dependencies install, development server starts on port 3000. Your browser automatically opens to http://localhost:3000 showing the dashboard.
Verification Test 1: Template Creation
Navigate to the Templates tab in the dashboard. This tests template storage and retrieval.
Steps:
Enter name “Server Health Weekly”
Add description “Weekly server metrics summary”
Click Create Template
Expected result: Template appears in the list below with version 1. It shows metric count (3 metrics) and creation date. Database stores the template with correct query_config and layout_config.
What’s happening: Frontend sends POST request to /api/templates. Backend validates input, creates ReportTemplate record, commits to database, returns the created template. Frontend receives response and updates display.
Verification Test 2: Report Generation
Switch to the Report Builder tab. This tests the complete generation pipeline.
Steps:
Enter report name “Weekly Metrics”
Select “Server Health Weekly” template from dropdown
Check PDF, Excel, and CSV output formats
Click Create Report
Find the new report in the list below
Click Generate button
Expected result: Report creates successfully. Generation button changes to show “Generating...” status. After 3-5 seconds, status updates to “Completed”. Output format chips appear showing PDF, Excel, CSV.
What’s happening: System creates ReportDefinition record, triggers background task, executes query to generate metrics data, renders template, converts to three formats in parallel, stores files in generated_reports directory, updates execution record.
Verify generated files:
ls backend/generated_reports/1/
You should see three files with timestamps: report_20250216_143052.pdf, report_20250216_143052.xlsx, report_20250216_143052.csv
Open the PDF—it contains styled tables with metrics, embedded charts showing trends, proper pagination. Open the Excel file—it has formatted headers, data with number formatting, embedded line chart. Open the CSV—it has metadata comments at top, then data rows.
Verification Test 3: Schedule Creation
Go to the Schedules tab. This tests cron parsing and schedule management.
Steps:
Select existing report from dropdown
Choose “Daily at 8 AM” from frequency options
Click Create Schedule
Expected result: Schedule appears in the list with Active status (green chip). It displays the cron expression “0 8 * * *” and shows next run time (tomorrow at 8 AM in UTC).
What’s happening: Frontend sends cron expression to backend. CronScheduler parses it, calculates next run time considering timezone. Backend creates ReportSchedule record with is_active=true.
The scheduler would trigger this report generation automatically at 8 AM daily in production. Our demo doesn’t run the scheduler background worker, but the infrastructure is complete.
Verification Test 4: Distribution List
Navigate to the Distribution tab. This tests recipient management.
Steps:
Enter list name “Engineering Team”
Click Add Recipient three times
Enter three email addresses
Click Create List
Expected result: Distribution list appears showing recipient count (3 recipients) and channels (email). Expanding the list displays all three addresses.
What’s happening: Frontend collects email addresses, structures them as recipient objects with type=”email”, sends to backend. Backend creates DistributionList record with recipients JSON array.
In production, after generating a report, you’d click a “Distribute” button to send it to this list. The distributor would resolve addresses, send emails with attachments, track delivery confirmations.
Running Tests
The implementation includes automated tests. Run them to verify everything works correctly.
Backend tests:
cd backend
source venv/bin/activate
pytest tests/ -v
Expected output: All tests pass. You see test_execute_query PASSED, test_query_with_aggregations PASSED. Tests verify query execution, aggregations, and data structure.
Frontend tests:
cd frontend
CI=true npm test
Expected output: Test suite completes without failures. React component tests verify rendering, user interactions, API integration.
Dashboard UI Verification
The dashboard should match professional SaaS products. Check these visual elements:
Header: Dark blue app bar with icon, system title “Advanced Reporting System”, subtitle showing “Day 110: Production-Grade Reporting Infrastructure”
Navigation: Four tabs (Report Builder, Templates, Schedules, Distribution) with clear active state indicator
Cards: White cards with subtle shadows, rounded corners, proper padding and spacing between elements
Forms: Clean input fields with floating labels, validation messages, help text where appropriate
Buttons: Primary blue buttons with hover effects, disabled states during operations, loading spinners when processing
Status Indicators: Color-coded chips—green for success/active, gray for pending/inactive, red for errors
Spacing: Consistent 16-24px gaps between sections, generous padding inside cards, comfortable line height in text
Typography: Clear hierarchy—18px bold for card titles, 14px for body text, 11px for secondary information
The overall aesthetic should feel polished and professional, similar to DataDog’s interface or Stripe’s dashboard.
Testing Strategy
Unit tests verify individual components in isolation. Test report builder query execution with various configurations. Verify aggregations compute correctly—mean, max, p95 all produce expected values. Check edge cases like empty results, missing columns, invalid time ranges.
Test each format converter produces valid output. Load generated PDFs with PyPDF2 to verify structure. Open Excel files with openpyxl and check formula evaluation. Parse JSON and validate schema matches expectations.
Test scheduler cron parsing with different timezones. Verify jitter adds expected randomness. Check “skip on conflict” prevents duplicate execution when previous run still active.
Integration tests exercise complete workflows end-to-end. Create template → create report → generate → verify files exist → distribute → confirm delivery. Test format conversion pipeline—same data through four formats, verify content consistency.
Test scheduler execution—create schedule → wait for trigger → verify report generated → check distribution occurred. These tests catch integration issues that unit tests miss.
Load tests simulate production conditions. Generate 100 concurrent reports and measure average latency, database connection count, memory usage peaks. Test thundering herd scenario—5,000 reports scheduled for same minute, verify jitter spreads load appropriately.
Common Issues & Solutions
Issue: Report generation times out
Solution: Reduce time range parameter (try 1 day instead of 7), add query timeout configuration to prevent hanging indefinitely
Issue: PDF charts not rendering
Solution: Verify matplotlib backend supports non-GUI environments (use Agg backend), check image buffer handling in PDFConverter
Issue: Excel formulas not evaluating
Solution: Use openpyxl data_only=False when writing. Formulas evaluate when users open the file in Excel.
Issue: Cron schedule not triggering
Solution: Verify timezone matches server timezone. Check croniter parsing succeeds. Ensure scheduler background worker runs.
Issue: Email distribution fails
Solution: Check SMTP credentials in config. Verify recipient email addresses valid. Review rate limiting configuration.
Production Deployment Checklist
Before deploying to production, complete these essential tasks:
Configure real metrics database connection (replace sample data generator with actual Prometheus/InfluxDB queries). Set up Redis for Celery task queue—this enables distributed scheduling across multiple workers. Configure SMTP credentials for email distribution with proper authentication.
Add S3 credentials for report storage with appropriate bucket policies. Enable SSL/TLS for all API endpoints using proper certificates. Implement authentication and authorization—users should only see their team’s reports.
Add comprehensive audit logging for all operations. Log template modifications, report generations, distribution actions with user identity and timestamp. Set up monitoring for queue depth, execution times, error rates. Alert when queue depth exceeds thresholds or error rates spike.
Configure backup strategy for report database. Daily snapshots with point-in-time recovery capability. Document all API endpoints, data models, deployment procedures for your team.
Performance Optimization
Query optimization starts with database indexes. Add indexes on report_id, template_id, state columns for fast lookups. Use connection pooling to reuse connections instead of opening new ones for each request.
Format conversion benefits enormously from parallelization. Generate formats simultaneously using asyncio. One report taking 45 seconds sequential becomes 15 seconds with 3-way parallelism. CPU cores sit idle during sequential generation but fully utilized during parallel conversion.
Caching reduces redundant computation. If 50 teams request “server CPU metrics for last 7 days” within 5 minutes, cache the first query result. Serve from cache for subsequent requests. Database sees 1 query instead of 50. Cache invalidation happens automatically after 5-minute TTL.
Storage optimization implements lifecycle policies. Archive reports older than 90 days to cheaper storage tiers (S3 Glacier). Apply compression to CSV and JSON files—they compress extremely well, often 10:1 ratio.
Security Considerations
Template sandboxing prevents code injection attacks. Whitelist allowed Jinja2 filters, block file system access, prevent imports. Users can’t embed os.system("rm -rf /") in templates even if they try.
Access control enforces row-level security on query results. If Alice can only see “team:frontend” metrics, the system automatically filters all her queries. She sees only frontend data even when using templates that query all teams.
Encryption protects sensitive data. Encrypt reports containing PII or financial data at rest and in transit. Use AES-256 for storage, TLS 1.3 for transmission. Generate signed URLs for secure downloads with time-limited access.
Audit trails log every action. Template modifications, report generations, distribution operations all recorded with user identity, timestamp, and details. These logs support compliance requirements and incident investigation.
Success Criteria
You’ve successfully implemented advanced reporting when:
Users build custom reports by clicking through UI, not writing code
The same report generates as PDF, Excel, CSV, and JSON without duplication
Scheduled reports run reliably across timezones without manual intervention
Adding new recipients to distribution list automatically includes them in next cycle
System handles 100 concurrent report generations without latency degradation